LinkedIn video is growing and shrinking at the same time, and both headline numbers are correct. Total video watch time on LinkedIn rose 36% year over year, a platform-reported figure measured in July 2024. Average views per video post fell 36% year over year, an independently measured figure covering 1.3 million posts across 16,645 company Pages between January 2024 and December 2025. The two numbers measure different things: one is aggregate consumption across the whole platform, the other is what a single company video actually earns. Video posting on company Pages doubled from two to four posts a month over the same window, which is how both can be true at once.
Every statistic below carries its source, its publication date, the period it measures, and a label showing whether LinkedIn measured itself or an outside party measured LinkedIn. That last distinction turns out to matter more than any individual number.
Key Takeaways
- The famous “up 36%” figure is from July 2024 and has no methodology attached. LinkedIn published it as “viewership” in one document and “watch time” in another. Most articles citing it in 2026 present it as current.
- Every growth statistic about LinkedIn video comes from LinkedIn. Every decline statistic comes from independent measurement with a disclosed sample. Neither side is lying. They are answering different questions.
- Video is not LinkedIn’s top-performing organic format. Native document posts earn a 7.00% engagement rate against video’s 6.00%, measured across 1.3 million posts.
- The likeliest cause of falling per-post views is competition, not the algorithm. Video output per Page doubled while attention did not, and two independent studies reached the same conclusion from separate datasets.
- Creative decisions drive 73% of video completions, and only 7% of 13,000 B2B video ads LinkedIn analysed contained any human emotion. The scarcity is the opportunity.
Content
The two numbers everyone gets wrong
The most-repeated statistic about LinkedIn video is roughly two years old, and the second most-repeated one says the opposite. Neither is wrong. They are measuring different things, and no page currently ranking for this topic says so.
1. LinkedIn reported video viewership rose 36% in 2024. The figure appears in LinkedIn’s Creative Labs report on video storytelling, footnoted to “LinkedIn First Party Data July 2024.” PLATFORM-REPORTED. No methodology, sample, or baseline is disclosed.
2. The same 36% was published as a different metric. In a LinkedIn Pulse post published in February 2025, LinkedIn Senior Director of Product Lakshman Somasundaram wrote that video “is being watched 36% more year over year.” Creative Labs calls the same number viewership. The Pulse post calls it watch time. Those are different measurements, and the drift happened in LinkedIn’s own materials. PLATFORM-REPORTED.
3. LinkedIn recorded 154 billion video views in calendar year 2024. Footnoted to LinkedIn First Party Data in the Creative Labs report. PLATFORM-REPORTED.
4. Video creation grew at twice the rate of other original post formats. From the same February 2025 LinkedIn post. This is the supply-side number, and it is the key to the whole puzzle. PLATFORM-REPORTED.
5. Average video views per post fell 36% year over year across every Page size. Socialinsider’s LinkedIn benchmarks, published March 2026, analysed 1.3 million posts from 16,645 LinkedIn business Pages active between January 2024 and December 2025. The decline held across every follower band from 1,000 to one million. INDEPENDENTLY MEASURED.
6. Video posts per Page doubled from two to four per month. Also Socialinsider, same dataset. Image posts rose from five to seven per month, native documents from one to two. INDEPENDENTLY MEASURED.
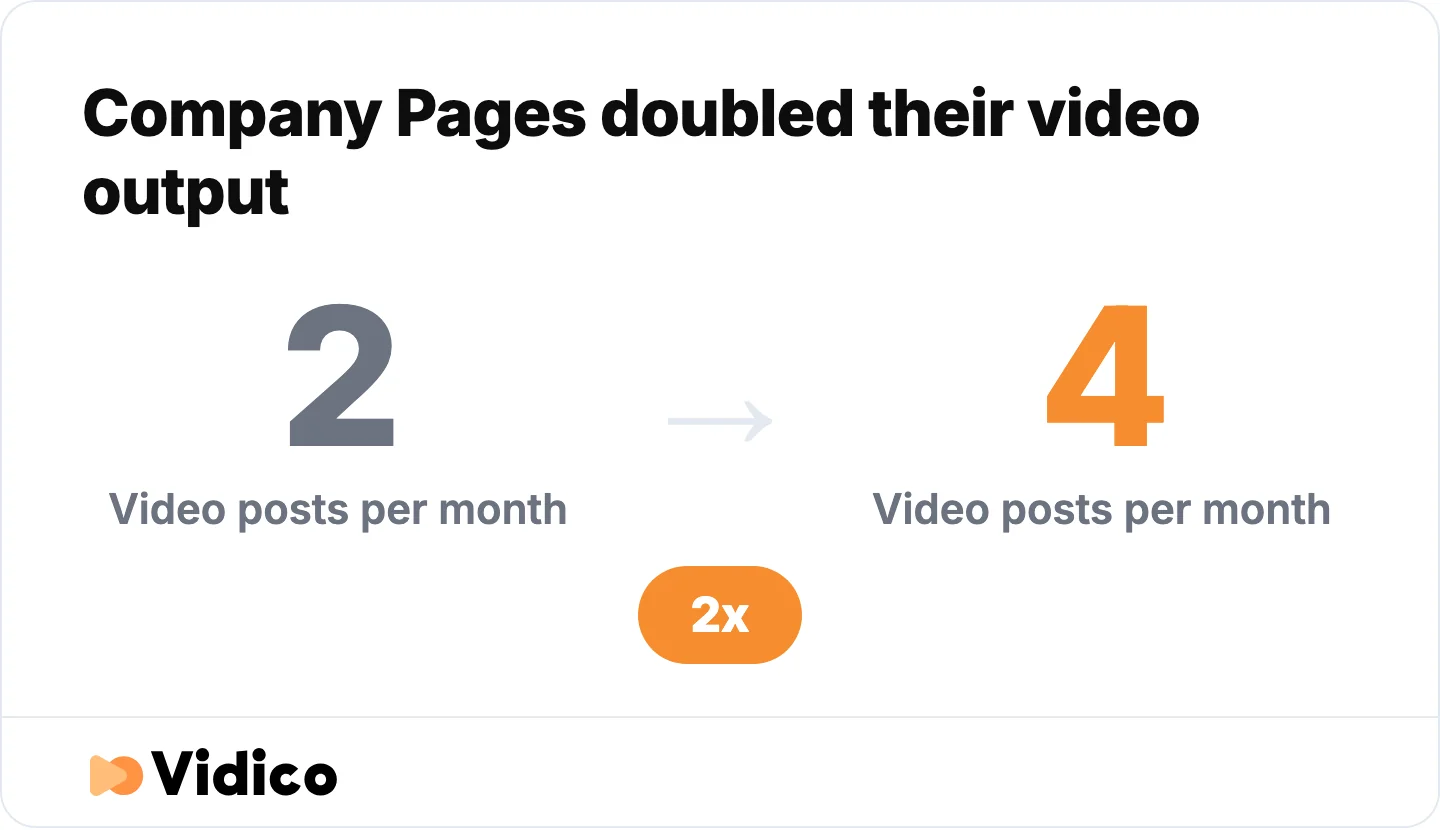
Company Pages doubled their monthly video output between January 2024 and December 2025. Source: Socialinsider LinkedIn benchmarks, 1.3 million posts from 16,645 Pages.
7. A second independent study reached the same conclusion from a different dataset. Metricool’s LinkedIn study, published April 2026, analysed 673,658 posts from 63,108 accounts and concluded that for video, “adoption has outpaced performance.” Metricool does not reproduce the 36% figure. It confirms the direction and the mechanism, not the number. INDEPENDENTLY MEASURED.
8. LinkedIn’s current growth claim is about paid video, not organic. LinkedIn reported that paid video content grew almost 30% year over year in Q1 2026, as covered by Social Media Today. Marketers comparing their organic reach against LinkedIn’s growth headlines are comparing two different products. PLATFORM-REPORTED.
How both 36% figures can be true
| LinkedIn’s +36% | Socialinsider’s −36% | |
|---|---|---|
| Metric | Total watch time, aggregate | Average views per video post |
| Population | Whole platform, including personal profiles | Company Pages only (16,645) |
| Period measured | Calendar 2024 | January 2024 to December 2025 |
| Published | February 2025 | March 2026 |
| Source type | Platform-reported, no methodology | Independently measured, n = 1.3 million posts |
Aggregate watch time can rise while views per post fall, provided the number of videos posted rises faster than total demand for them. The measured data is consistent with that explanation. Company Pages doubled their video output, and LinkedIn’s own figure confirms video creation grew at twice the rate of every other format. Double the supply against a slower-growing pool of attention, and each individual video gets a smaller slice.
The practical read for a marketing team is neither headline. More video is being watched on LinkedIn overall, any individual company video is earning materially fewer views than it did two years ago, the likeliest cause is competition rather than an algorithmic penalty, and per-video engagement quality actually improved slightly over the same period. The difference between organic and paid video performance explains most of the remaining confusion.
LinkedIn video reach and usage benchmarks
LinkedIn passed 1.3 billion members in 2026, and its video figures need to be read against a platform that has grown by double digits for four consecutive years. Scale statistics on this topic are frequently misreported as user counts when they measure advertising reach.
9. LinkedIn has 1.3 billion members. From Microsoft’s FY26 Q3 earnings call in April 2026, where LinkedIn was also described as “the leading B2B sales and advertising channel for large and small businesses.” PLATFORM-REPORTED, disclosed as part of Microsoft’s financial reporting.
10. LinkedIn advertising reached 1.20 billion members in January 2025. From DataReportal’s LinkedIn statistics, compiled from LinkedIn’s own ad-planning tools. Advertising reach is not the same as active users, and should never be presented as one. INDEPENDENTLY COMPILED.
11. LinkedIn ad reach grew by 176 million members, or 17.1%, between January 2024 and January 2025. DataReportal, same dataset. INDEPENDENTLY COMPILED.
12. LinkedIn’s audience skews male, at 56.9% male to 43.1% female. DataReportal. INDEPENDENTLY COMPILED.
13. The largest LinkedIn audiences by country are the United States at 250 million, India at 150 million, Brazil at 81.0 million, and the United Kingdom at 45.0 million. DataReportal. INDEPENDENTLY COMPILED.
14. Video uploads to LinkedIn rose more than 20% year over year. From Microsoft’s FY25 Q4 earnings call in July 2025, verbatim: “comments on LinkedIn rose over 30% and video uploads increased over 20% this year.” This is upload volume, not consumption, and it is the supply side of the pattern in numbers 5 and 6. PLATFORM-REPORTED.
15. Comments on LinkedIn rose more than 30% over the same year. Microsoft’s FY25 Q4 earnings call, from the same sentence as number 14. The same call put LinkedIn at 1.2 billion members with four consecutive years of double-digit member growth. PLATFORM-REPORTED.
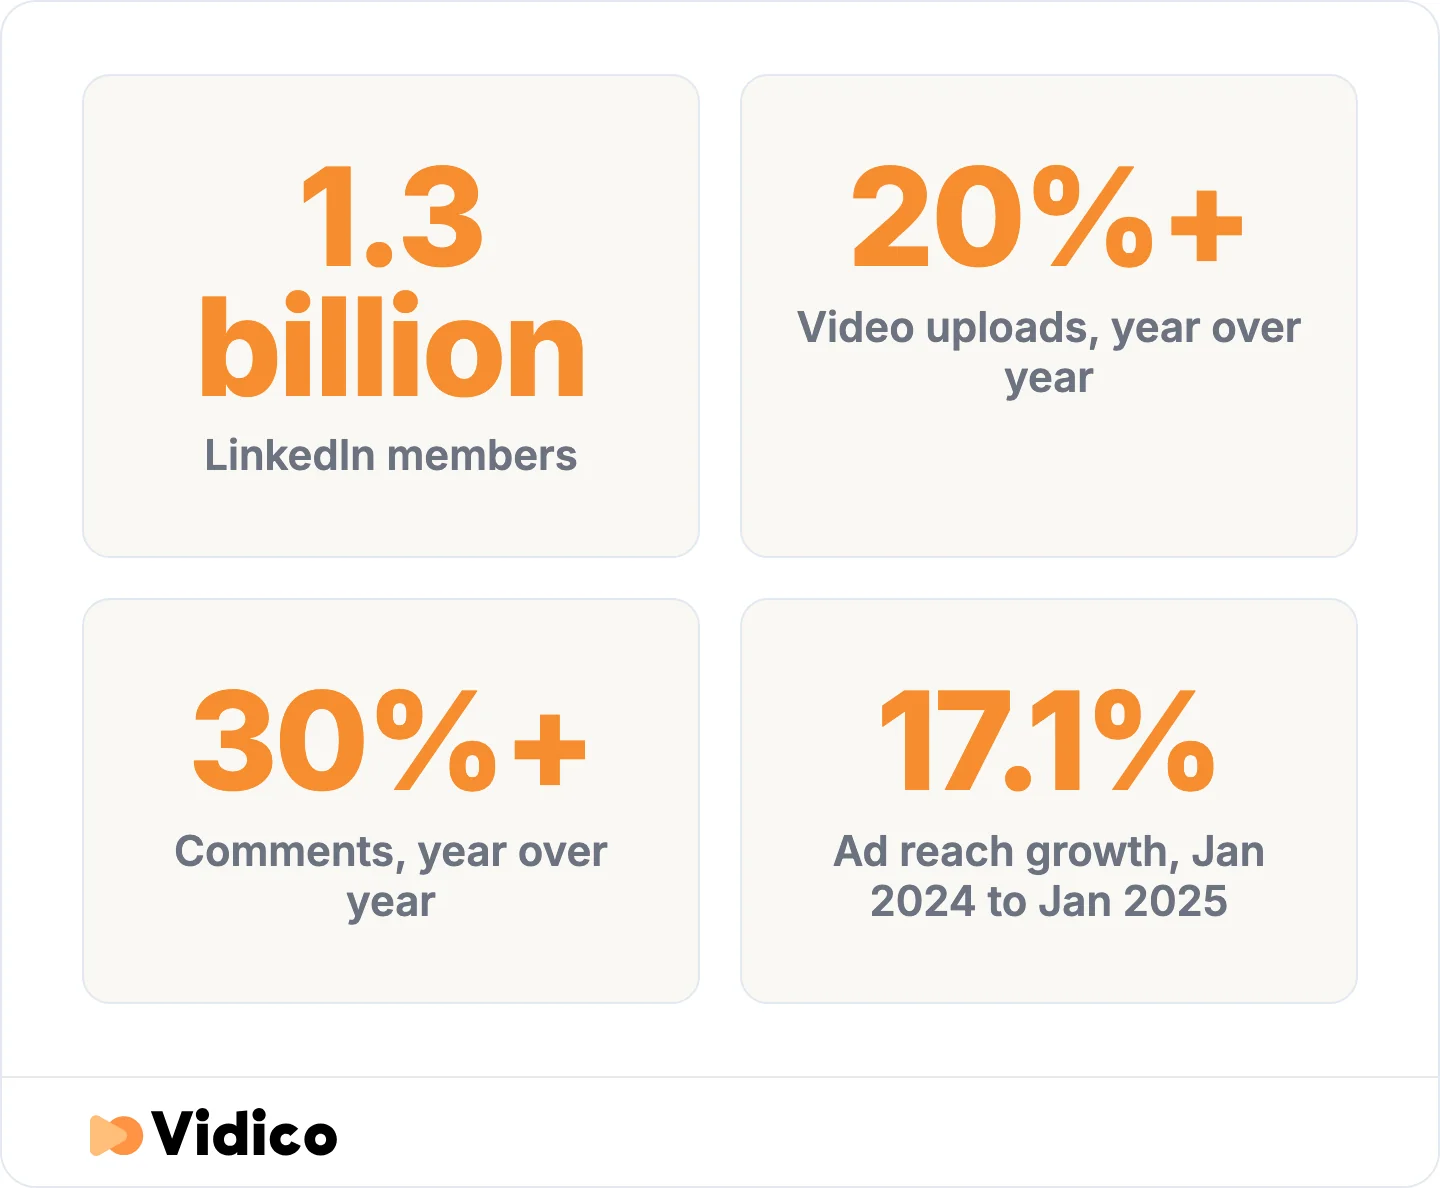
LinkedIn grew on every axis it reports on, including video uploads. Sources: Microsoft FY26 Q3 and FY25 Q4 earnings calls, DataReportal.
16. Gen Z is the fastest-growing demographic on LinkedIn. Stated in LinkedIn’s Creative Labs report without a supporting figure. It is unquantified at the source, and any article attaching a percentage to it has added one. PLATFORM-REPORTED.
Our wider B2B video marketing statistics cover how these platform-level numbers compare against other channels.
That B2B skew lines up with what we see in B2B video production work more broadly — LinkedIn is where B2B budgets concentrate.
LinkedIn video engagement benchmarks
Video earns a 6.00% engagement rate on LinkedIn, which places it second among seven formats rather than first. Native document posts outperform it. This is the single most decision-relevant statistic on the topic and it is absent from most pages covering it.
17. LinkedIn video engagement rate reached 6.00% in 2025, up from 5.60% the previous year. Socialinsider, 1.3 million posts. That is a 7% relative improvement, measured over the same period that views per post fell 36%. INDEPENDENTLY MEASURED.
18. Native document posts beat video on engagement rate. Socialinsider’s full format ranking:
| Format | Engagement rate | Year-over-year change |
|---|---|---|
| Native document | 7.00% | +14% |
| Multi-image | 6.45% | Not stated |
| Video | 6.00% | +7% |
| Image | 5.30% | +9% |
| Text | 4.50% | +12% |
| Poll | 4.20% | Not stated |
| Link | 3.25% | Not stated |
INDEPENDENTLY MEASURED.
19. Video posted the smallest engagement gain of the four formats Socialinsider tracked year over year, at +7% against native documents at +14%, text at +12%, and images at +9%. INDEPENDENTLY MEASURED.
20. Average video views scale with Page size, from 155 views for Pages with 1,000 to 5,000 followers up to 1,380 views for Pages with 100,000 to one million followers. Socialinsider. INDEPENDENTLY MEASURED.
21. Platform-wide, likes fell 13%, comments fell 17%, and shares fell 10% year over year, while clicks rose 5% and overall engagement rose nearly 14%. Metricool, 673,658 posts. The gap between falling visible interactions and rising overall engagement is what Metricool attributes to clicks, swipes and video views. INDEPENDENTLY MEASURED.
22. Personal profiles earn 63% higher engagement than company Pages. Metricool. This matters for reading every other statistic here, because Socialinsider’s video decline was measured on company Pages only, which is the weaker surface to begin with. INDEPENDENTLY MEASURED.
23. Image and video posts make up nearly 75% of all content published on company Pages, yet carousels, multi-image posts and polls consistently outperform them. Metricool. INDEPENDENTLY MEASURED.
24. Polls deliver the highest average impressions on company Pages despite accounting for less than 1% of posts. Metricool. INDEPENDENTLY MEASURED.
25. Video is now the most-used format on personal profiles, but underperforms relative to carousels, image posts and multi-image content. Metricool, which noted this reverses its own 2025 finding that video was one of LinkedIn’s fastest-growing formats. INDEPENDENTLY MEASURED.
A pattern runs through numbers 23, 24 and 25. On LinkedIn in 2026, the scarce format wins. Polls are under 1% of company Page posts and lead on impressions. Native documents are the least-published major format and lead on engagement. Video became the most-published format and its per-post returns fell. Our video marketing statistics hub tracks how this compares across other platforms.
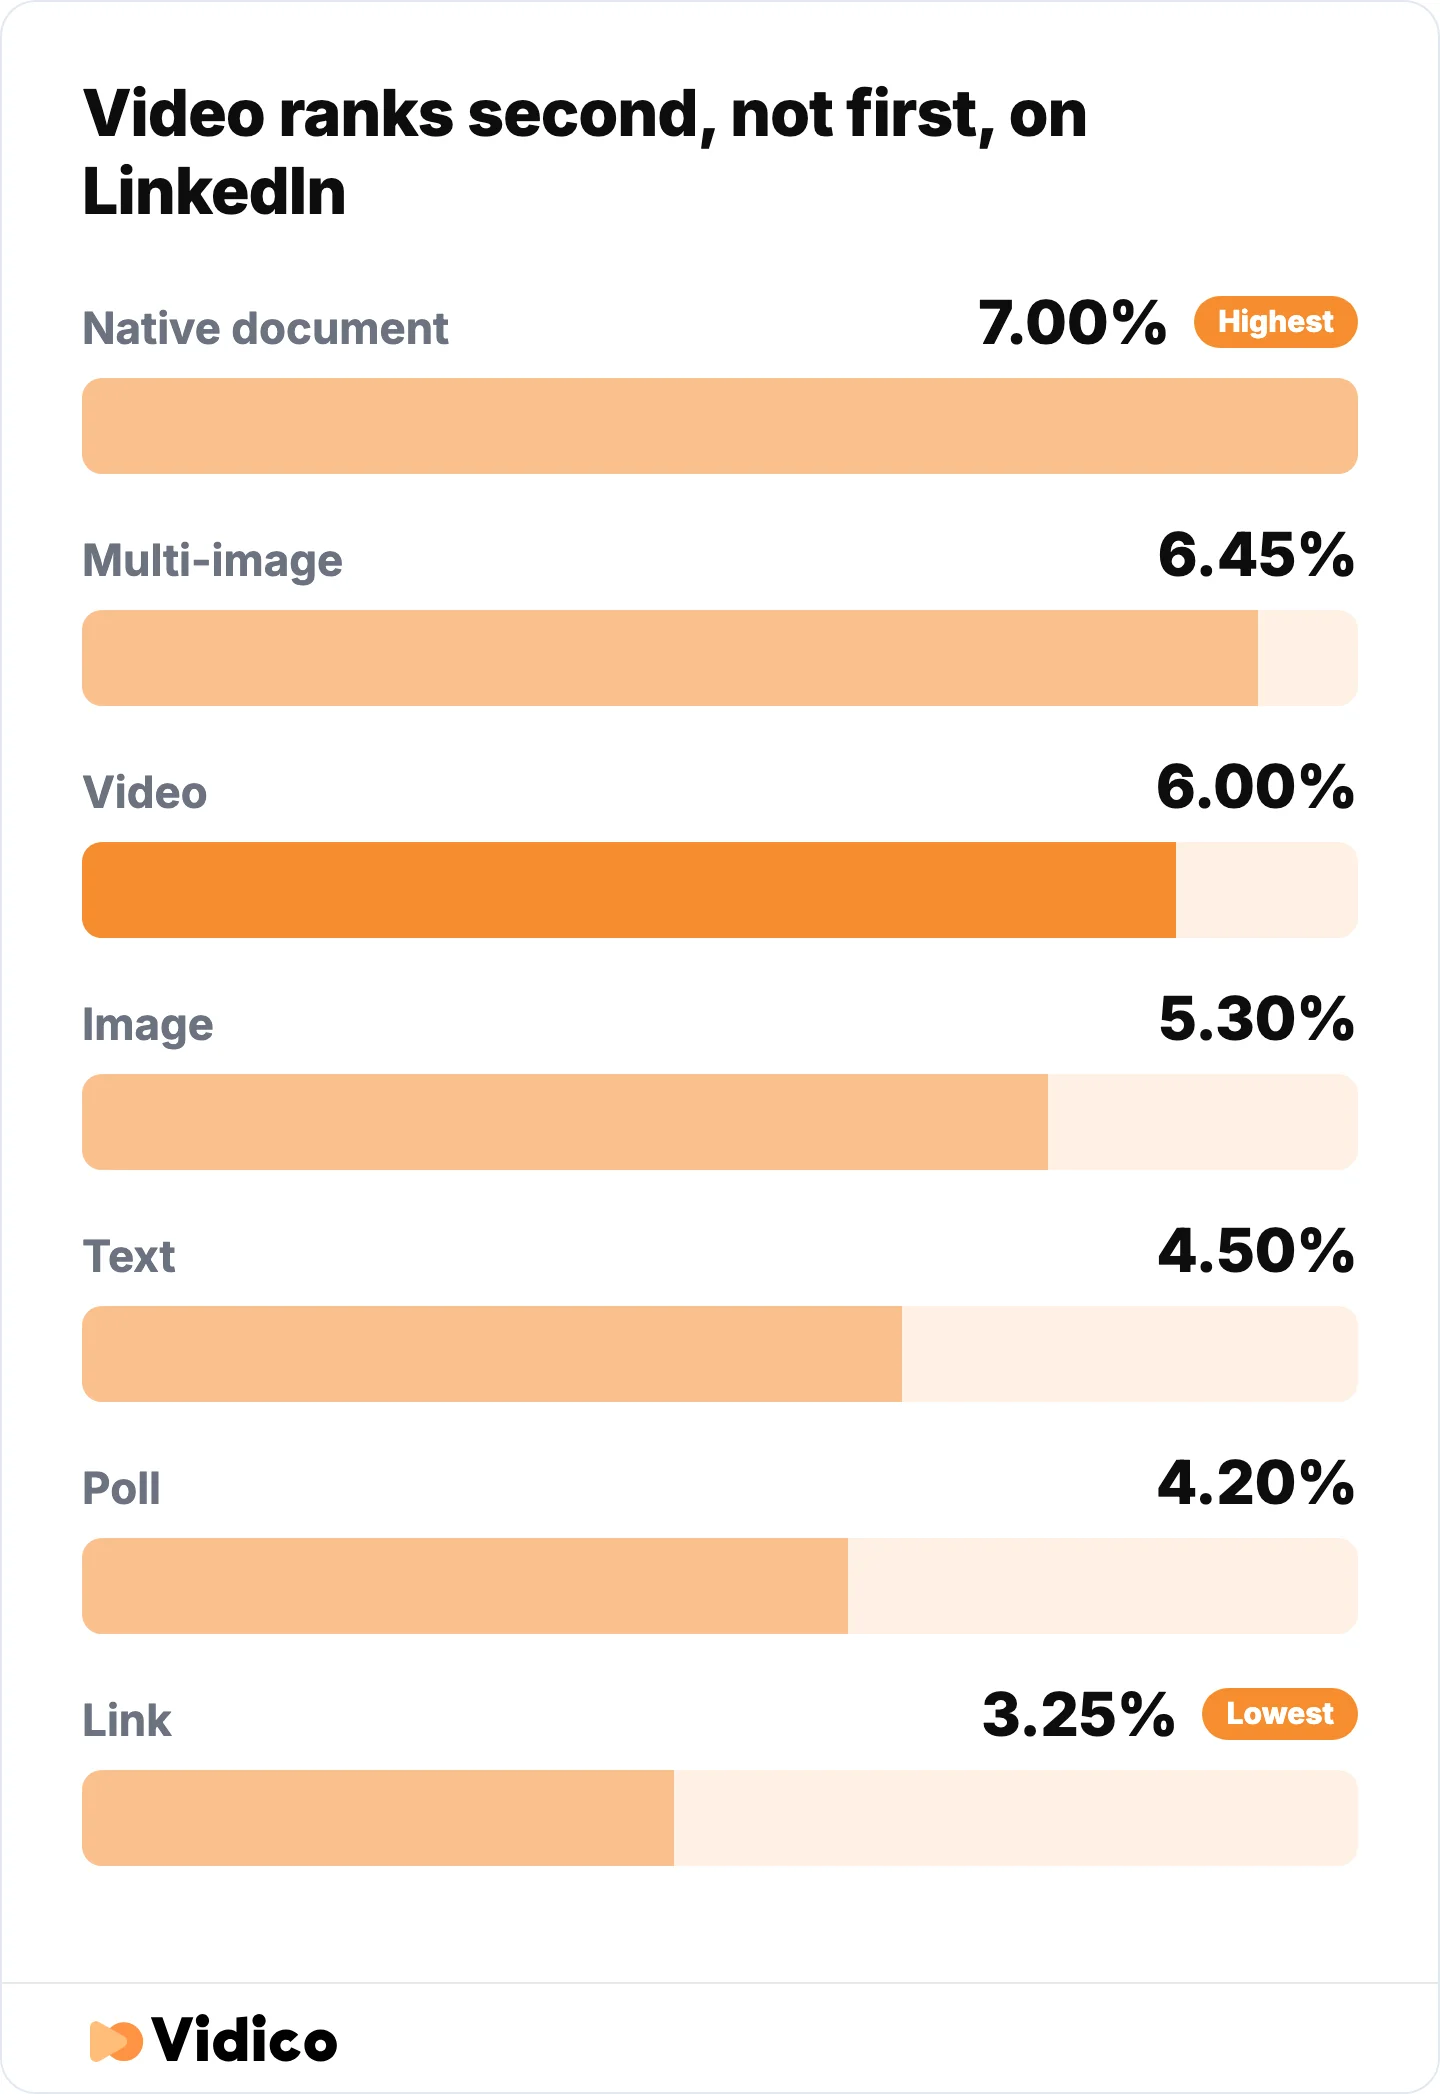
Video sits second of seven formats, behind native documents. Source: Socialinsider, 1.3 million posts from 16,645 LinkedIn business Pages.
How LinkedIn actually counts a video view
A LinkedIn video view is any playback lasting more than two seconds. LinkedIn states this directly, and the definition is looser than most benchmark comparisons assume.
26. LinkedIn defines video views as “the total number of times your video was watched for more than 2 seconds, including sponsored and organic views.” Quoted verbatim from LinkedIn’s content analytics help documentation. PLATFORM-REPORTED.
27. LinkedIn defines “time viewed” as “the cumulative length of time your video was viewed, including sponsored and organic views.” Same source. This is the metric behind aggregate watch-time claims. PLATFORM-REPORTED.
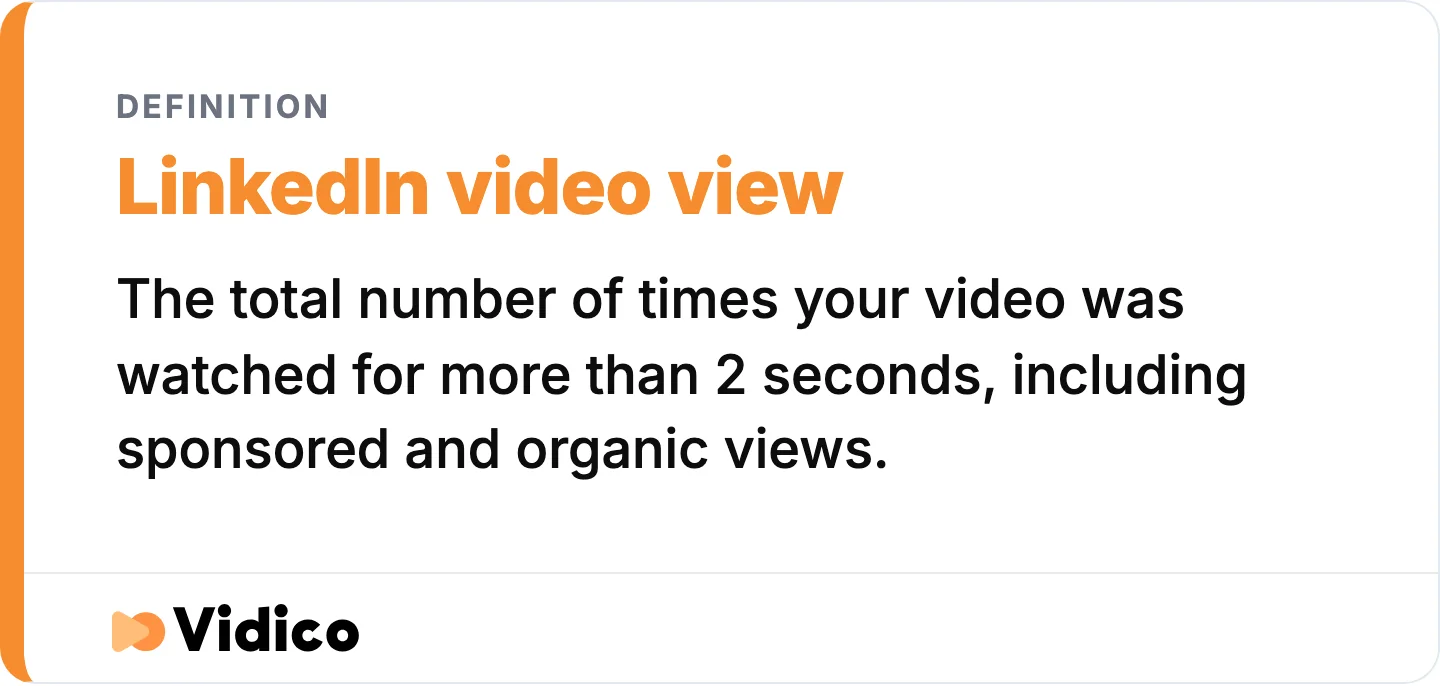
A view needs only two seconds of playback, which makes view counts a measure of exposure rather than attention. Source: LinkedIn content analytics help documentation.
28. LinkedIn added average watch time as a new metric rather than redefining views. Digiday reported in February 2025 that LinkedIn introduced average watch time alongside its existing view and total-watch-time metrics. This matters when comparing figures across years: the view definition itself did not change, so year-over-year view comparisons remain valid. PLATFORM-REPORTED, independently reported.
29. LinkedIn added an in-network versus out-of-network split to post analytics in mid-2026, letting a poster see how much reach came from followers and connections against everyone else. Observed by practitioners in July 2026; we could not locate a formal LinkedIn announcement, so treat the date as approximate. PLATFORM-REPORTED, partially verified.
One correction worth making. Several summaries of this definition, including the AI Overview Google currently returns for this query, state that a LinkedIn view requires two seconds of playback “with at least 50% of pixels in view.” That pixel condition does not appear on LinkedIn’s content analytics help page. LinkedIn’s published definition is the two-second threshold quoted above, with no visibility qualifier attached. The stricter condition may exist in LinkedIn’s ad measurement standards, but it should not be attributed to this definition without a separate source.
The practical consequence: a two-second threshold means view counts are a weak proxy for attention. A video with 5,000 views and a 3-second average watch time and a video with 5,000 views and a 25-second average watch time report the same headline number.
Video length and format: what the data supports
Two length findings are frequently quoted about LinkedIn video, and the most-quoted one is from 2018 with an undisclosed baseline. The better-sourced figure points at 15 to 30 seconds for ads.
30. Video ads running 15 to 30 seconds delivered a 13% lift in click-through rate. From an analysis by creative platform VidMob covering more than 16,000 ads and 804 million impressions, published by LinkedIn. This is the best-methodology length statistic available on the topic. PLATFORM-REPORTED, independently analysed.
31. Videos under 30 seconds reported a 200% lift in view completion rates, according to a LinkedIn internal study published on LinkedIn’s video ad tips page. The study dates to 2018 and the baseline is not disclosed, so the multiple cannot be independently checked. PLATFORM-REPORTED.
32. The same LinkedIn study found that longer-form content drove as many clicks and views as shorter videos, because longer videos help tell a more complex product or brand story. This sentence sits directly beside the 200% figure in LinkedIn’s own material and is almost universally dropped when the statistic is quoted. PLATFORM-REPORTED.
33. Cinematic brand films running 31 to 60 seconds delivered a 61% uplift against six-second formats. LinkedIn Creative Labs. PLATFORM-REPORTED, paid ads only.
34. Vertical video formats earned 34% higher engagement, and face-to-camera content held attention 34% longer than square brand-awareness content. LinkedIn Creative Labs. PLATFORM-REPORTED, paid ads only.
35. Horizontal formats earned 59% higher dwell time than square formats. LinkedIn Creative Labs. PLATFORM-REPORTED, paid ads only.
Numbers 33 and 34 look contradictory and are not. Vertical wins on engagement, the tap-and-react behaviour of a thumb-driven feed. Horizontal wins on dwell time, the sustained-attention behaviour of someone who has decided to watch. The right aspect ratio depends on which of those two things the video is for, which is a more useful conclusion than either statistic alone. Our guide to explainer video length covers how this plays out beyond LinkedIn.
LinkedIn video ad benchmarks
Paid video is the part of LinkedIn video that is unambiguously growing. It is also where LinkedIn publishes the most data, and where the most important benchmark is missing entirely.
36. Paid video ads on LinkedIn grew 30% year over year. Reported by eMarketer, citing Nadella on Microsoft’s fiscal Q2 2026 earnings call in January 2026. INDEPENDENTLY REPORTED from a platform figure.
37. LinkedIn members spend almost 3x more time watching video ads than time spent with static Sponsored Content. From LinkedIn’s announcement of its B2B video products, published in 2018 and measured on its beta cohort. The figure is eight years old and measured on an early, small population. PLATFORM-REPORTED.
38. Company Page video is 5x more likely than other content types to start a conversation. Same 2018 LinkedIn beta announcement. The metric is specifically conversation starts, not engagement, and the baseline is “other types of content,” not text posts. Both details are routinely lost when this statistic is requoted. PLATFORM-REPORTED.
39. Video posts are shared 20 times more than any other form of content on LinkedIn. LinkedIn Creative Labs, footnoted to LinkedIn First Party Data January 2025. An older and weaker version of this claim circulates from a 2017 spokesperson quote; the 2025 first-party version is the one to use. PLATFORM-REPORTED.
40. Lead Gen Forms with clear calls to action produced a 3x increase in open rates. LinkedIn Creative Labs. PLATFORM-REPORTED, paid ads only.
41. LinkedIn Live broadcasts earn 7x more reactions and 24x more comments than native videos produced by the same broadcasters. From LinkedIn’s guidance on B2B live event streaming. The same-broadcaster baseline is what makes this comparison meaningful, since it controls for audience size. PLATFORM-REPORTED.
One benchmark does not exist publicly, and pretending otherwise is how bad numbers spread. There is no reliable published figure for LinkedIn video ad cost per view, cost per completed view, or median view-through rate. We could not locate a primary source for any of them. A 39.5% median view-through rate circulates widely, including inside Google’s AI Overview for this query, but it traces only to marketing blogs with no stated methodology. Anyone quoting a LinkedIn video completion benchmark to you should be able to name the study behind it. If they cannot, the number is decoration. Planning a video budget against a fabricated benchmark is worse than planning against none.
What LinkedIn’s own creative study found
LinkedIn analysed more than 13,000 B2B video ads across 550,000 frames and 70 dimensions, and concluded that creative execution accounts for most of video performance. The full dataset sits in a PDF that most coverage summarises from screenshots, so the specifics below are rarely available in text.
42. Creative decisions account for 73% of video completions and 49% of video engagement. LinkedIn Creative Labs. PLATFORM-REPORTED, paid ads only.
43. Only 7% of the 13,000 B2B video ads analysed featured any human emotion. LinkedIn described this as a missed opportunity. It is the most useful number in the entire study, because it quantifies how uncontested the obvious move is. PLATFORM-REPORTED, paid ads only.
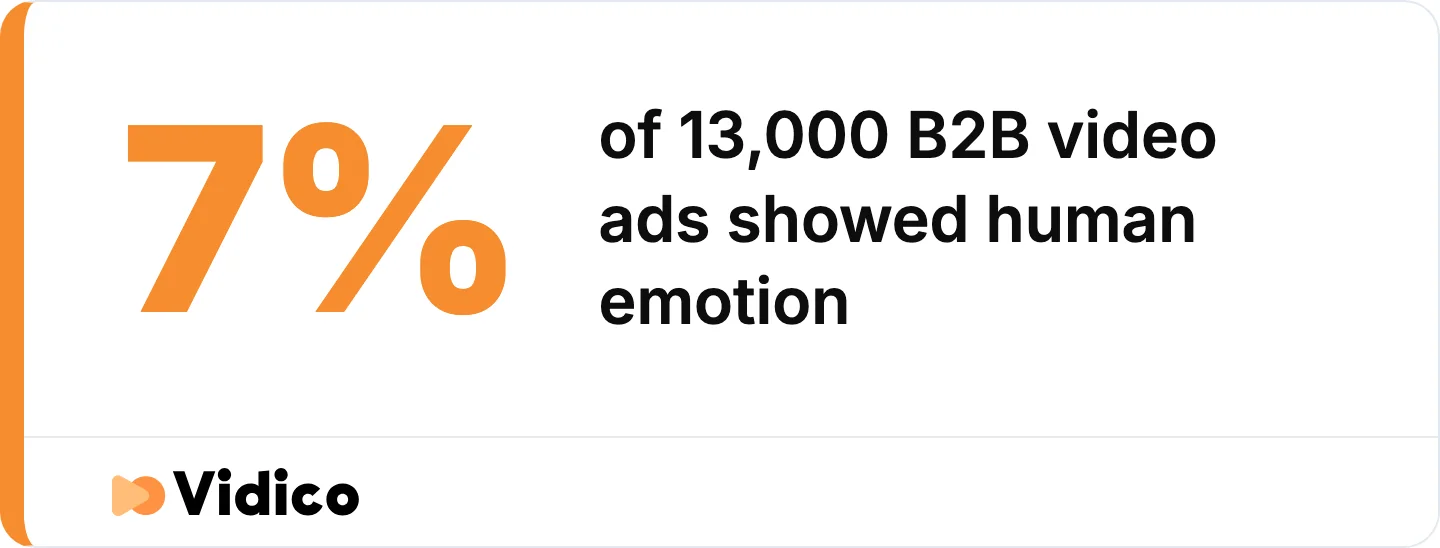
LinkedIn analysed more than 13,000 B2B video ads and found human emotion in 7% of them. Source: LinkedIn Creative Labs.
44. Meme formats lifted engagement 111%, and pop-culture references lifted it 41%. LinkedIn Creative Labs. PLATFORM-REPORTED, paid ads only.
45. Authentic emotion lifted engagement 78%, authentic rather than staged delivery lifted it 41%, and simply having a real person visibly present lifted it 14%. LinkedIn Creative Labs. PLATFORM-REPORTED, paid ads only.
46. Scripts built on human experience outperformed abstract concepts by 18% and product-led messaging by 10%. LinkedIn Creative Labs. PLATFORM-REPORTED, paid ads only.
47. Expert credibility produced the largest single lifts in the study: subject-matter experts at 40%, executive experts at 53%, and an expert filmed on a conference stage rather than in an abstract setting at 70%. A contrarian point of view at the consideration stage added 22%. LinkedIn Creative Labs. PLATFORM-REPORTED, paid ads only.
48. Production choices moved results in the 13% to 30% range: bold colour palettes at 15%, on-screen graphic supers at 18%, bulleted captions at 30% higher dwell time, step-by-step structures at 13% higher dwell time, and dynamic camera shots at 13%. LinkedIn Creative Labs. PLATFORM-REPORTED, paid ads only.
49. High-production brand films earned 103% higher dwell time than generic ads, and unpolished “real talk” videos earned 129% greater engagement. LinkedIn Creative Labs. The two formats sit at opposite ends of the production-value scale and both beat the middle. PLATFORM-REPORTED, paid ads only.
50. Emotionally resonant brand films lifted performance 67%, and a strong inspirational message lifted it 36%. LinkedIn Creative Labs. PLATFORM-REPORTED, paid ads only.
LinkedIn’s own summary of the study, reported by Social Media Today, is that the best-performing videos “didn’t necessarily have the most impressive production budgets, but they were the most creatively intentional, emotionally grounded, and culturally in tune.” Read alongside number 43, that is a specific and unusually practical finding: the thing that works is the thing almost nobody is doing. This is a large part of why video marketing works when it is executed with intent rather than volume.
B2B buyer behaviour and video
Video adoption among B2B marketers is near-universal, and buyers report that short-form expert video shapes purchase decisions. The gap is in strategy rather than usage.
51. 78% of B2B marketers use video. From the LinkedIn and Ipsos B2B Marketing Benchmark, published July 2025, surveying 1,500 respondents. PLATFORM-REPORTED with independent fieldwork.
52. 63% of B2B buyers say short-form expert video informs their buying decisions. From LinkedIn research with GWI, n = 1,716, fielded May to June 2024. PLATFORM-REPORTED with independent fieldwork.
53. 55% of marketers say short-form social videos produce their highest return on investment. eMarketer B2B video marketing research, cited in LinkedIn’s Creative Labs footnotes. INDEPENDENTLY MEASURED, verified through a secondary citation chain.
54. 40% of marketers admit they struggle to create an effective video strategy. HubSpot video marketing research, cited in LinkedIn’s Creative Labs footnotes. INDEPENDENTLY MEASURED, verified through a secondary citation chain.
Numbers 51 and 54 describe the same population. Nearly four in five B2B marketers are producing video, and two in five say they do not have a strategy for it. That combination, more than any algorithm change, explains the supply glut measured in numbers 5 and 6. The constraint is not access to the format. It is knowing what to do with it.
What B2B teams say about creative in 2026
Marketing teams describe the same conditions the platform data measures, in different language. We surveyed more than 230 B2B tech marketing leaders for our 2026 State of Creative Marketing in Tech report, and the findings line up closely with what Socialinsider and Metricool recorded.
55. 42% of B2B tech marketers say getting attention is harder now, citing more competition and more sameness. In Vidico’s 2026 State of Creative Marketing in Tech report, n = 230+. This is the marketer-side account of the supply doubling that Socialinsider measured on company Pages.
56. 35% cite accelerating creative fatigue. Same report.
57. Paid social video and customer-proof video tied as the highest-impact formats for 2026. Same report. Read against the organic decline data, the direction this points is not away from video but toward specific kinds of it.
58. Teams judge creative success on engagement and views (52.1%), revenue influenced (36.3%), and conversion rate or cost per lead (35.0%). Same report. More than half stop at the metric that number 5 shows is falling for structural reasons rather than creative ones.
59. Mid-form video is now the leading content format, by a slim margin. Same report.
These are survey findings about how B2B tech marketing teams operate. They are not claims about our own results.
Statistics to stop repeating
Three widely-circulated claims about LinkedIn video do not survive checking. We have published two of them ourselves on this page in the past, which is part of why they are here.
The 95% retention claim is not a real finding
The claim: viewers retain 95% of a message from video, against 10% from text.
The problem: there is no study behind it. The number is usually attributed to a Wharton professor or to Dr. James McQuivey of Forrester, and neither attribution holds up. The marketing agency widely identified as the origin point, Insivia, has publicly acknowledged that the figure came from its own small survey of roughly 200 people and, in its own framing, took on a life of its own. We are naming the source rather than linking it, since it competes in our category. A survey of 200 people is not a basis for a general claim about human memory, and the 10% text comparison has no identifiable source at all.
What to say instead: cite a measured behaviour with a disclosed sample, such as LinkedIn’s finding that creative decisions account for 73% of video completions. It is a smaller claim and a real one.
The “36% growth” figure is not a 2026 statistic
The claim: LinkedIn video is up 36% year over year.
The problem: the underlying data is footnoted to July 2024, and the figure was published in February 2025. It describes calendar 2024. It is currently being repeated across 2026 articles, and inside Google’s AI Overview for this query, with no date attached. It is also published by LinkedIn under two different metric names, viewership and watch time, with no methodology attached to either.
What to say instead: state the figure with its date and metric, then note that independent measurement of company Pages over a longer window found per-post views moving the other way. Both are in numbers 1 through 7 above.
The “video gets 5x engagement” claim has drifted from its source
The claim: LinkedIn video earns 5x more engagement than other posts. A 4x version circulates alongside it, and both frequently appear in the same article.
The problem: the original 2018 LinkedIn statement was that Company Page video is 5x more likely to start a conversation, measured on a beta cohort. Starting a conversation is a narrower metric than engagement, the population was small and early, and the figure is eight years old. We could locate no LinkedIn source for a 4x engagement claim at all. Current independent measurement runs in the opposite direction, with video at a 6.00% engagement rate behind native documents at 7.00%.
What to say instead: use the Socialinsider format table in number 18. It is current, independently measured, and it gives the comparison the 5x claim is reaching for.
The “documents get 4x video engagement” claim is off by a factor of twenty
The claim: native document posts earn nearly 4x the engagement of video on LinkedIn. This is currently the most-shared statistic in the practitioner argument against posting video.
The problem: it contradicts the study it cites. Socialinsider’s own format table, the source these posts reference, puts native documents at 7.00% and video at 6.00%. That is a 17% gap, not 4x. The claim overstates the real difference by more than twenty times, and it is propagating through the discourse unchallenged.
What to say instead: documents currently outperform video on engagement rate by roughly 17%, and grew faster year over year at +14% against video’s +7%. The direction is real. The magnitude is not.
Three of these four corrections cut against video and one cuts for it. That is what checking sources rather than picking a side produces.
Turning these benchmarks into video that performs
The data above points somewhere specific. Per-post reach on company Pages is falling for structural reasons, engagement quality is holding, and the creative variables LinkedIn measured move results far more than posting volume does. That combination rewards fewer, better videos over more of them.
We produce B2B explainer and social video for SaaS and tech marketing teams, and LinkedIn performance is one of the places that work gets measured. Hospitality technology company TASK reached a 51% video view rate on LinkedIn with campaign work we produced, against the 6.00% engagement benchmark and the per-Page view ranges in number 20. Software company Modisoft recorded a 5% LinkedIn click-through rate alongside an 870,000-plus user reach and a 34% lift in organic impressions.
If you want to see how your current video creative measures against the variables in numbers 42 through 50, our Creative Intelligence Report analyses 12 areas of your existing creative and comes back within 48 hours.
Frequently Asked Questions
What counts as a video view on LinkedIn?
A LinkedIn video view is any playback longer than two seconds. LinkedIn’s content analytics documentation defines it as “the total number of times your video was watched for more than 2 seconds, including sponsored and organic views.” The threshold is low, which means view counts indicate exposure rather than attention. Average watch time is the better performance signal.
Is LinkedIn video growing or declining in 2026?
Both, depending on the metric. Total watch time across the platform grew 36% in calendar 2024 according to LinkedIn’s own first-party data. Average views per video post on company Pages fell 36% between January 2024 and December 2025 according to Socialinsider’s analysis of 1.3 million posts. Aggregate consumption rose while per-post returns fell, because video output per Page doubled over the same window.
What is a good engagement rate for LinkedIn video?
6.00% is the current benchmark for video on LinkedIn, measured by Socialinsider across 1.3 million posts from 16,645 business Pages. That places video second among seven formats. Native document posts lead at 7.00%, and multi-image posts sit at 6.45%. Anything above 6% puts a video ahead of the measured average for the format.
Is the “video increases retention by 95%” statistic true?
No. The claim has no study behind it. It is commonly attributed to Wharton or to a Forrester analyst, and neither attribution is supportable. The agency identified as its origin has acknowledged the number came from its own survey of roughly 200 people. The accompanying “10% for text” comparison has no identifiable source. Treat any article still citing it as unchecked.
How long should a LinkedIn video be?
For ads, 15 to 30 seconds has the strongest evidence behind it, with a 13% click-through-rate lift measured across more than 16,000 ads and 804 million impressions. For brand films, LinkedIn measured a 61% uplift at 31 to 60 seconds against six-second formats. LinkedIn’s own 2018 research also found longer videos drove as many clicks and views as short ones when the story required the length, a finding usually omitted when the “under 30 seconds” advice is quoted.
Does video outperform other LinkedIn formats?
Not currently on engagement rate. Native document posts lead at 7.00% against video’s 6.00%, and multi-image posts also edge ahead at 6.45%. Metricool separately found that polls deliver the highest average impressions on company Pages while making up under 1% of posts. The pattern across both datasets is that scarce formats outperform saturated ones, and video became the most-published format on personal profiles.
Should B2B companies still post video on LinkedIn?
Yes, with different expectations than two years ago. Per-post views are down for structural reasons rather than quality ones, and engagement rates held steady while views fell. LinkedIn’s analysis of 13,000 B2B video ads found creative decisions drive 73% of completions, and only 7% of those ads contained any human emotion. The evidence supports producing fewer videos with more creative intent rather than either abandoning the format or increasing volume.
Conclusion
The honest answer on LinkedIn video statistics is that the topic has a provenance problem. The most-cited growth figure is from July 2024 with no methodology attached, published under two different metric names. The most-cited decline figure measures something else entirely on a narrower population. Both are real. Neither is the whole picture, and almost no page quoting either one tells you when it was measured or by whom.
The structural read is straightforward once the numbers are dated. Video supply on LinkedIn doubled, per-post views fell roughly in proportion, engagement quality held, and video sits second to native documents on engagement rate. Meanwhile LinkedIn’s own analysis of 13,000 video ads found that creative execution drives 73% of completions while only 7% of those ads carried any human emotion. The measured opportunity is not more video. It is video that does the thing almost nobody is doing.
Explainer and social video production for SaaS and tech marketing teams is our core work, and the campaigns that hold up against these benchmarks are the ones designed around a specific creative decision rather than a posting cadence. If you are working out what your next quarter of LinkedIn video should actually contain, a video strategy session is a practical place to start.
Sources
- LinkedIn Creative Labs: The Art and Science of Video Storytelling
- LinkedIn: Up 36% Over the Last Year, Video on LinkedIn Is Booming
- LinkedIn Help: Content Analytics for Your Page
- LinkedIn Marketing Blog: LinkedIn Goes All In on B2B Video
- LinkedIn Marketing Blog: Video Insights to Boost B2B Ad Performance
- LinkedIn Marketing Blog: B2B Live Event Streaming
- LinkedIn Marketing Solutions: Video Ad Tips
- Socialinsider: LinkedIn Benchmarks
- Metricool: LinkedIn Study
- DataReportal: Essential LinkedIn Stats
- Microsoft Investor Relations: FY26 Q3 Earnings
- Microsoft Investor Relations: FY25 Q4 Earnings
- Social Media Today: LinkedIn Shares Insights Into Key Elements Driving Video Engagement
- Social Media Today: LinkedIn Shares Video Creation Tips Based on Platform Trends
- eMarketer: LinkedIn Video Ads Drive 30% Growth
- Digiday: Why LinkedIn Is Spotlighting the Average Watch Time Metric