
Short-form video is vertical video under roughly 60 seconds, built for TikTok, Instagram Reels, YouTube Shorts and Facebook Reels. It now takes 58% of all time spent on social media, and marketers rank it the number one content format for return on investment.
Most statistics circulating about this format cannot be traced to a source. We reviewed the pages currently ranking for this keyword, and the one sitting in first place carries 97 statistics without a single outbound citation. Several numbers repeated across the whole category turn out to have no study behind them at all. Every figure below carries a named source, a publication year and a geography. Five widely-repeated statistics did not survive that check, and we have documented why in their own section rather than quietly dropping them.
Key Takeaways
- Short-form video takes 58% of social media time, the largest single share of any content format on social platforms
- Marketers rank short-form video first for ROI at 49%, ahead of long-form video at 29% and live-streaming at 25%
- Videos under one minute hold a 52% engagement rate, though longer videos earn higher click-through, a trade-off almost nobody reports
- US digital video ad spend passes $80 billion in 2026, growing nearly 20% faster than the total ad market
- LinkedIn draws 27% short-form engagement against Instagram’s 52%, which matters more than any headline number if your buyers are B2B
Content
Consumption and Reach
Short-form video now accounts for the majority of social media time worldwide, and the generational gap in daily use runs about ten to one.
- Short-form video takes 58% of all time spent on social media. Reels, Shorts and TikTok together account for the majority of social platform time, according to DataReportal and We Are Social’s Digital 2026 Global Overview Report, which draws on Similarweb app data. Global figure, published October 2025.
- 94.6% of online adults watched online video in the past 30 days. DataReportal’s Digital 2026 report puts video consumption close to universal among connected adults. Global.
- 5.79 billion social media user identities exist worldwide, more than two in three people on Earth, up 294 million (5.4%) year over year as of April 2026. DataReportal.
- The typical user spends 18 hours 36 minutes per week on social media, roughly 2 hours 39 minutes a day. DataReportal frames this figure as social networks plus video platforms combined. Social networks on their own account for more than one hour per day. Global.
- 84% of US adults have used YouTube, 71% Facebook, 50% Instagram and 37% TikTok. Pew Research Center’s Americans’ Social Media Use 2025 surveyed 5,022 US adults between February and June 2025 and published in November 2025. This is the cleanest US reach baseline available.
- 24% of US adults visit TikTok daily, but that splits about 50% of 18 to 29 year olds against 5% of those 65 and over. Pew Research Center. That ten-to-one gap is the most reliable generational datapoint on short-form video, and it is considerably more precise than the widely-repeated claim that “over 90% of Gen Z and Millennials” watch short-form content.
- 80% of US adults aged 18 to 29 use Instagram, against 19% of those 65 and over. Pew Research Center.
- 254 million people in the United States use social media, 73.0% of the population, up 0.4% year over year. DataReportal’s Digital 2026: The United States of America, based on October 2025 data.
- TikTok’s active users will spend 47 minutes a day on the platform in 2026 in the US. EMARKETER’s US Time Spent With Social Networks 2026 also projects US social network users will pass two hours a day across all social platforms.
- US 18 to 24 year olds spend 59 minutes a day on YouTube against 58 minutes on TikTok. EMARKETER’s US Digital Habits by Generation 2026 notes teens are the only age group spending more time on TikTok than YouTube.
- US adults will spend 13 hours 26 minutes per day with media in 2026. EMARKETER. This is total media time across every channel, which is the honest denominator for any claim about how much video people watch.
- The typical TikTok user spends 1 hour 37 minutes a day in the Android app, against 1 hour 13 minutes for Instagram and roughly 1 hour 25 minutes for YouTube. DataReportal, using Similarweb data. This measures Android app time globally and runs roughly double the US per-user figure in statistic 9. The two numbers measure different things and should never be presented as alternatives.
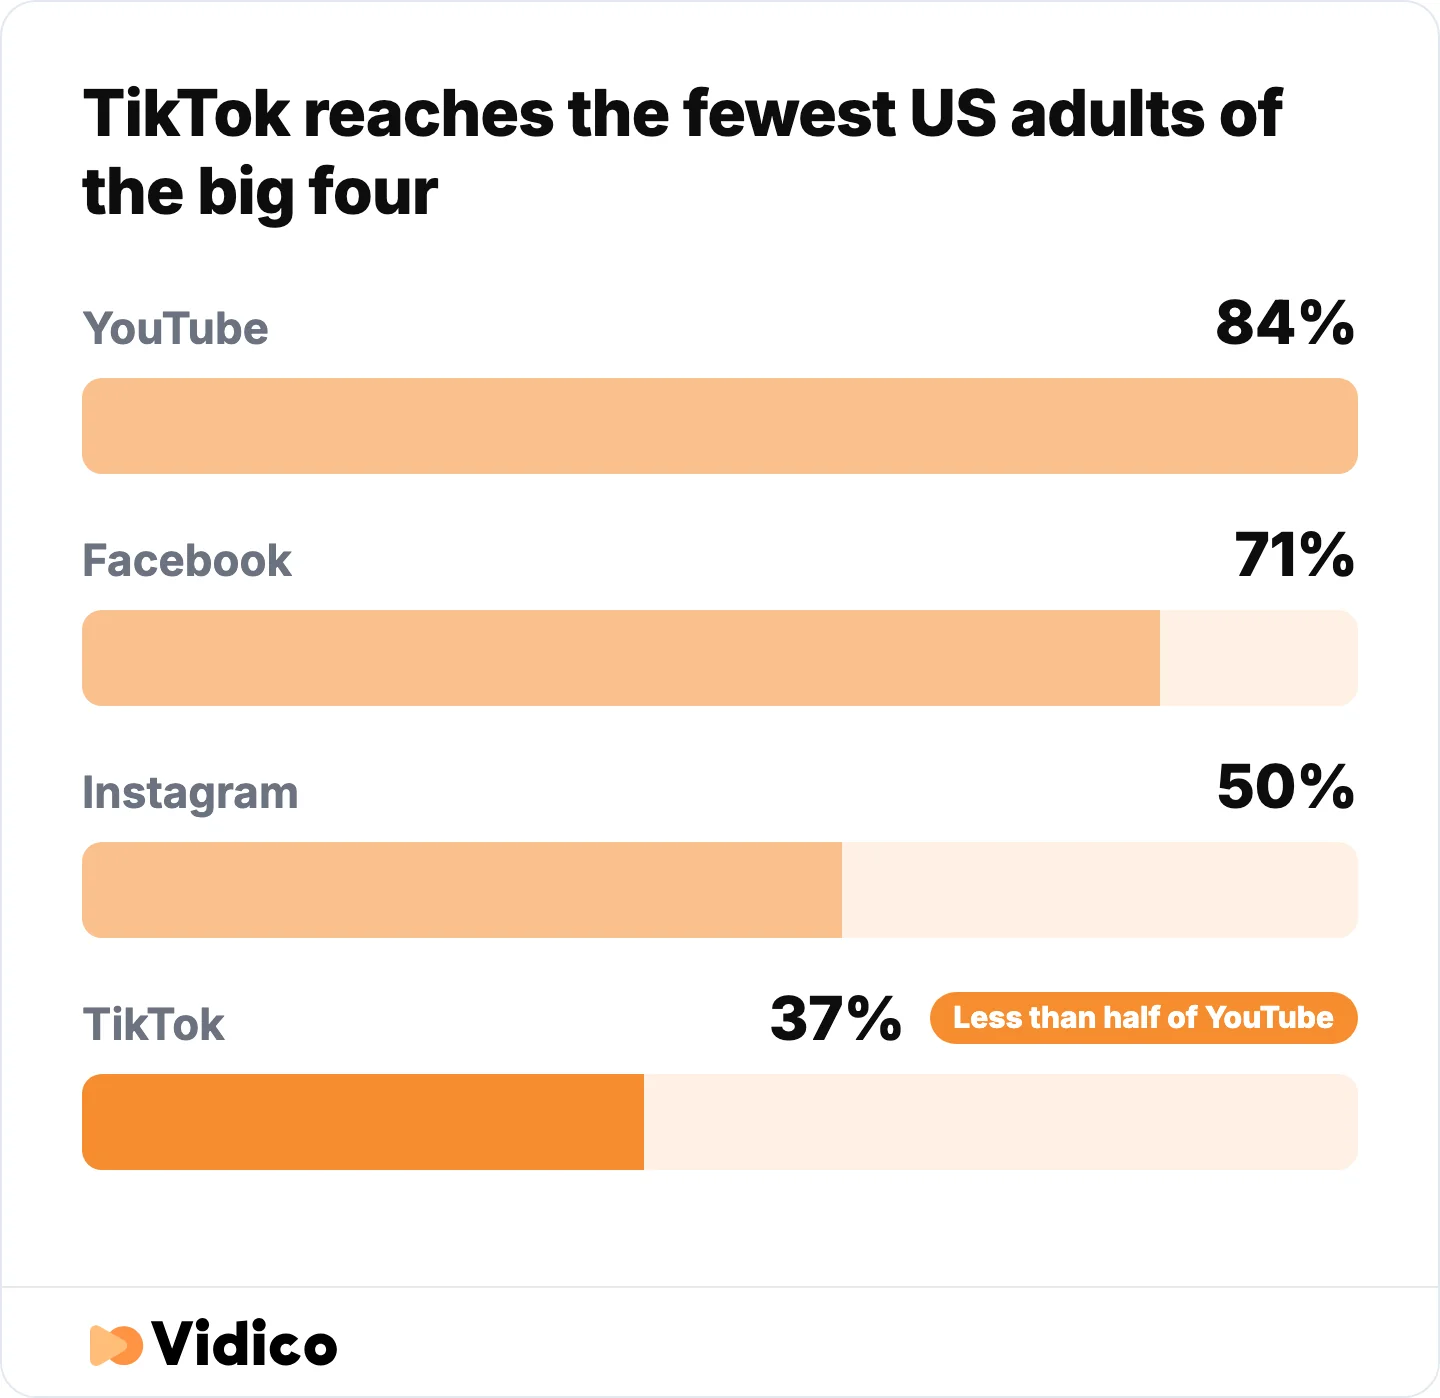
TikTok gets the most attention in short-form video, but it reaches the fewest US adults of the four major platforms. Source: Pew Research Center, Americans’ Social Media Use 2025 (5,022 US adults).
Attention, Engagement and Video Length
Videos under one minute hold about half their audience, but the engagement advantage of short video comes with a cost that most statistics pages leave out.
- Videos under one minute hold a 52% engagement rate, meaning viewers watch just over half the runtime on average. Wistia’s 2026 State of Video Report, published April 2026. This is the dated, sourced replacement for the untraceable claim that videos under 90 seconds retain 50% of viewers.
- Product videos under a minute hit 50% engagement and customer testimonials 46%. Wistia’s 2026 State of Video Report. The format split matters for B2B teams choosing where to spend production budget.
- 65% of viewers watch business videos under one minute to the end, against 20% for videos over 20 minutes. Vidyard’s Video in Business Benchmark Report, covering roughly one million videos including 943,305 created in 2024. This is Vidyard’s own platform data and reflects business and B2B video specifically, not the wider market.
- Engagement drops 11% past the 30-minute mark. Wistia’s 2026 State of Video Report.
- Videos between 5 and 30 minutes earn a 9% click-through rate on interactive elements. Wistia’s 2026 State of Video Report. This is the counterweight nobody in this category reports: short video wins on percentage of runtime watched, longer video wins on clicks. Both are true, and choosing between them is a strategy decision rather than a data question.
- Wistia’s benchmarks draw on 13 million videos, 79 million hours of viewing and a survey of more than 900 video professionals. Publishing the methodology is rare in this category. Most short-form video statistics circulate with no sample size attached at all.
- The average TikTok video runs 42.7 seconds, up from 39 seconds in 2023. Metricool’s social media study, published via Statista, using 2024 data. Global. This is the best-sourced version of the video-length claim that appears on nearly every competing page.
- 90% of ad recall impact is captured within the first six seconds. TikTok Marketing Science Creative Coding Analysis, conducted by Kantar across 3,500 ads in the US, Canada and UK. The ads ran between January and October 2021 and the analysis published in 2022, so treat it as directional rather than current.
- Showing the product on screen lifts brand affinity 65% and recall 25%. TikTok Marketing Science and Kantar, same 2022 analysis.
- 90% of video teams are taking steps toward accessibility. Wistia’s 2026 State of Video Report. This is the defensible figure on captions. The widely-quoted claim that “85% of videos are watched without sound” traces to a 2016 trade article in which two publishers self-reported the number, and it has never been confirmed by any platform.
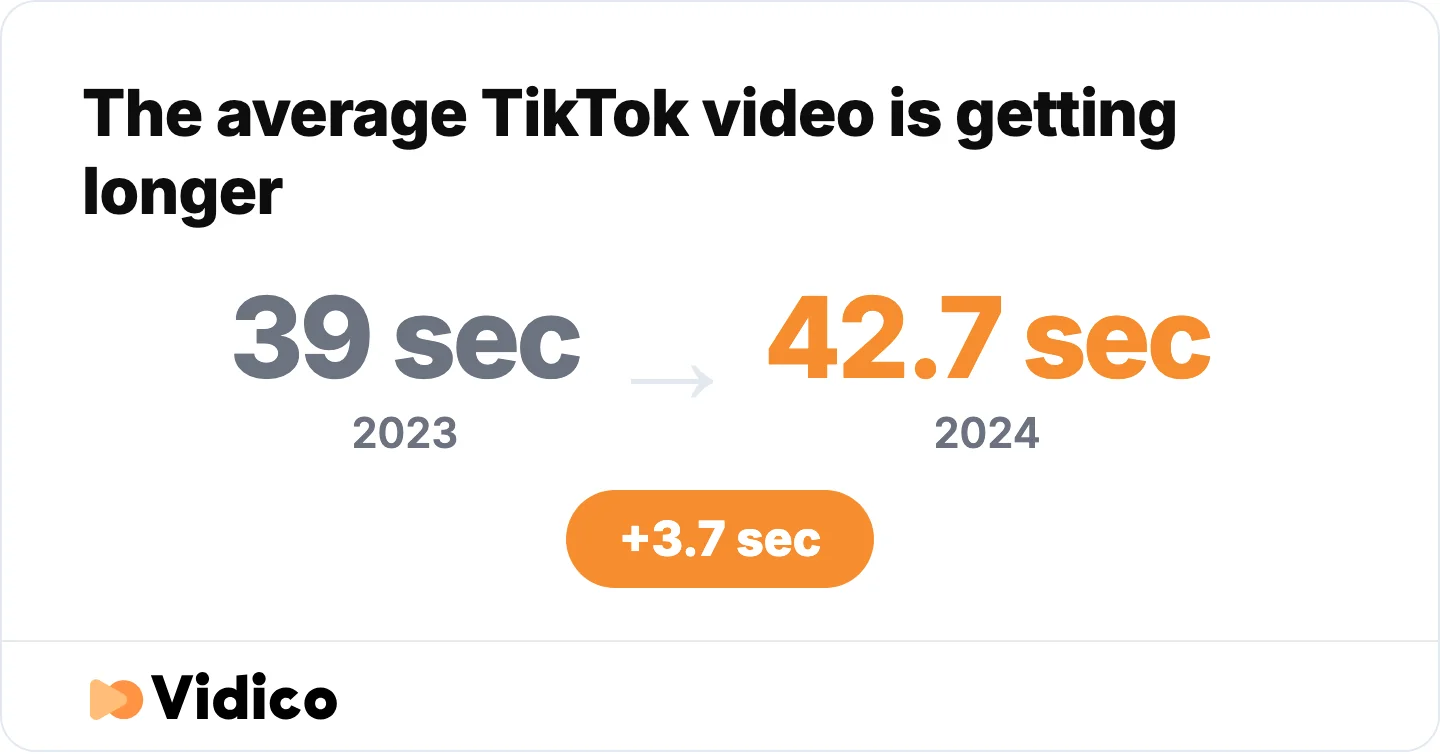
The average TikTok upload is getting longer, not shorter. Source: Metricool social media study, published via Statista, 2024 data (global).
Platform Dynamics: YouTube Shorts, Reels and TikTok
YouTube Shorts and Instagram Reels both publish primary usage figures. TikTok has not updated its official global user number since 2021, which is why platform-share claims about it should be treated carefully.
- YouTube Shorts averages 200 billion daily views. Stated by YouTube CEO Neal Mohan in his 2026 annual letter, published January 2026. Global. Mohan first gave this figure in June 2025 and it was unchanged seven months later, so read it as a rounded plateau rather than a live growth number.
- Viewers watch over one billion hours of YouTube on their televisions every day. Neal Mohan, YouTube’s official blog. Global. Short-form video is not a phone-only format.
- YouTube takes 13.4% of all US television watch time across every screen, making it the largest single media distributor. Nielsen’s Media Distributor Gauge for April 2026, published June 2026. YouTube has led all distributors for roughly three consecutive years.
- Streaming accounts for 47.6% of total US TV viewing. Nielsen’s The Gauge, April 2026. The record of 47.5% was set in December 2025.
- 84.6% of YouTube’s US advertising audience is reachable on a TV screen, against a global average of 40.5%. Sprout Social’s 2026 analysis, citing DataReportal. US.
- Instagram passed 3 billion monthly active users. Mark Zuckerberg, Meta’s Q3 2025 earnings call, October 2025. Global.
- Video time spent on Instagram rose more than 30% year over year. Mark Zuckerberg, Meta Q3 2025 earnings call. This covers all Instagram video globally, not Reels specifically and not the US alone.
- Reels carries an annual revenue run rate above $50 billion. Mark Zuckerberg, Meta Q3 2025 earnings call. Facebook and Instagram Reels combined, global.
- Ranking changes in the first quarter of 2026 drove a 10% lift in Reels time spent. Meta’s Q1 2026 earnings call, April 2026. This is the most current Meta figure available.
- TikTok reaches 153 million US adults, 55.7% of the adult population, up 11.0% year over year. DataReportal’s Digital 2026: The United States of America, October 2025 data. This is derived from advertising reach rather than company-reported monthly users, which is worth stating because TikTok has not published a US user figure since 2024.
- Instagram reaches 182 million people in the US, 52.3% of the population, up 9.7% year over year. DataReportal. Instagram was the fastest-growing major US platform in that report.
- TikTok’s only official global milestone remains “more than 1 billion people every month,” announced in September 2021. TikTok Newsroom. No official update has followed. Any current TikTok global user figure you encounter is an estimate, not a company disclosure.
- In the UK, TikTok reaches 46% of smartphone adults and 65% of 18 to 34 year olds, while YouTube reaches 94% of adults for 51 minutes a day. Ofcom’s Online Nation 2025, published December 2025. These are UK figures and should not be read as US.
Marketing Impact and ROI
Marketers rank short-form video first for return on investment, and the two best-documented conversion studies both come from YouTube Shorts rather than TikTok.
- Marketers rank short-form video the top ROI-driving format at 49%, ahead of long-form video at 29% and live-streaming at 25%. HubSpot’s State of Marketing Report 2026, surveying more than 3,400 marketers globally.
- Short-form video is the media format marketers rely on most. HubSpot’s State of Marketing Report 2026 states this as a ranking rather than a percentage.
- Short-form video is the top media format marketers plan to invest in for 2026. HubSpot’s State of Marketing Report 2026. Global.
- 37.1% of marketers plan to increase their video marketing investment in 2026. HubSpot. Global.
- Short-form brand video engagement varies more than twofold across platforms: Instagram 52%, YouTube 52%, Facebook 48%, Bluesky 47%, X 37% and LinkedIn 27%. Sprout Social’s 2026 Content Strategy Report, a US-weighted consumer survey measuring the share of users most likely to engage with brand video under 60 seconds. For B2B teams, LinkedIn’s 27% is the single most important number on this page.
- 60% of TikTok users name short-form video their most-engaged brand content format, while 32% prioritise long-form. Sprout Social’s 2026 Content Strategy Report. US-weighted.
- YouTube Shorts Creator Ads lifted purchase intent 8.8% and produced 2.9 times more consumer intent to spend against competitors. A Google and Kantar meta-analysis published December 2025, covering 20 campaigns across 10 verticals with 5,802 respondents split between control and exposed groups at 95% confidence. This is the best-documented conversion statistic available on short-form video, and it is a measured lift rather than a self-reported survey answer.
- YouTube Shorts ads deliver 2.3 times higher long-term return on ad spend than paid social. YouTube Ads. US.
- 81% of video teams distribute on LinkedIn and 76% on YouTube. Wistia’s 2026 State of Video Report. The sample skews B2B, which is worth noting before reading it as a market-wide figure.
- Business video creation grew 88% year over year, with per-user creation up 241%. Vidyard’s Video in Business Benchmark Report, 2024 data. This reflects Vidyard’s customer base rather than the whole market.
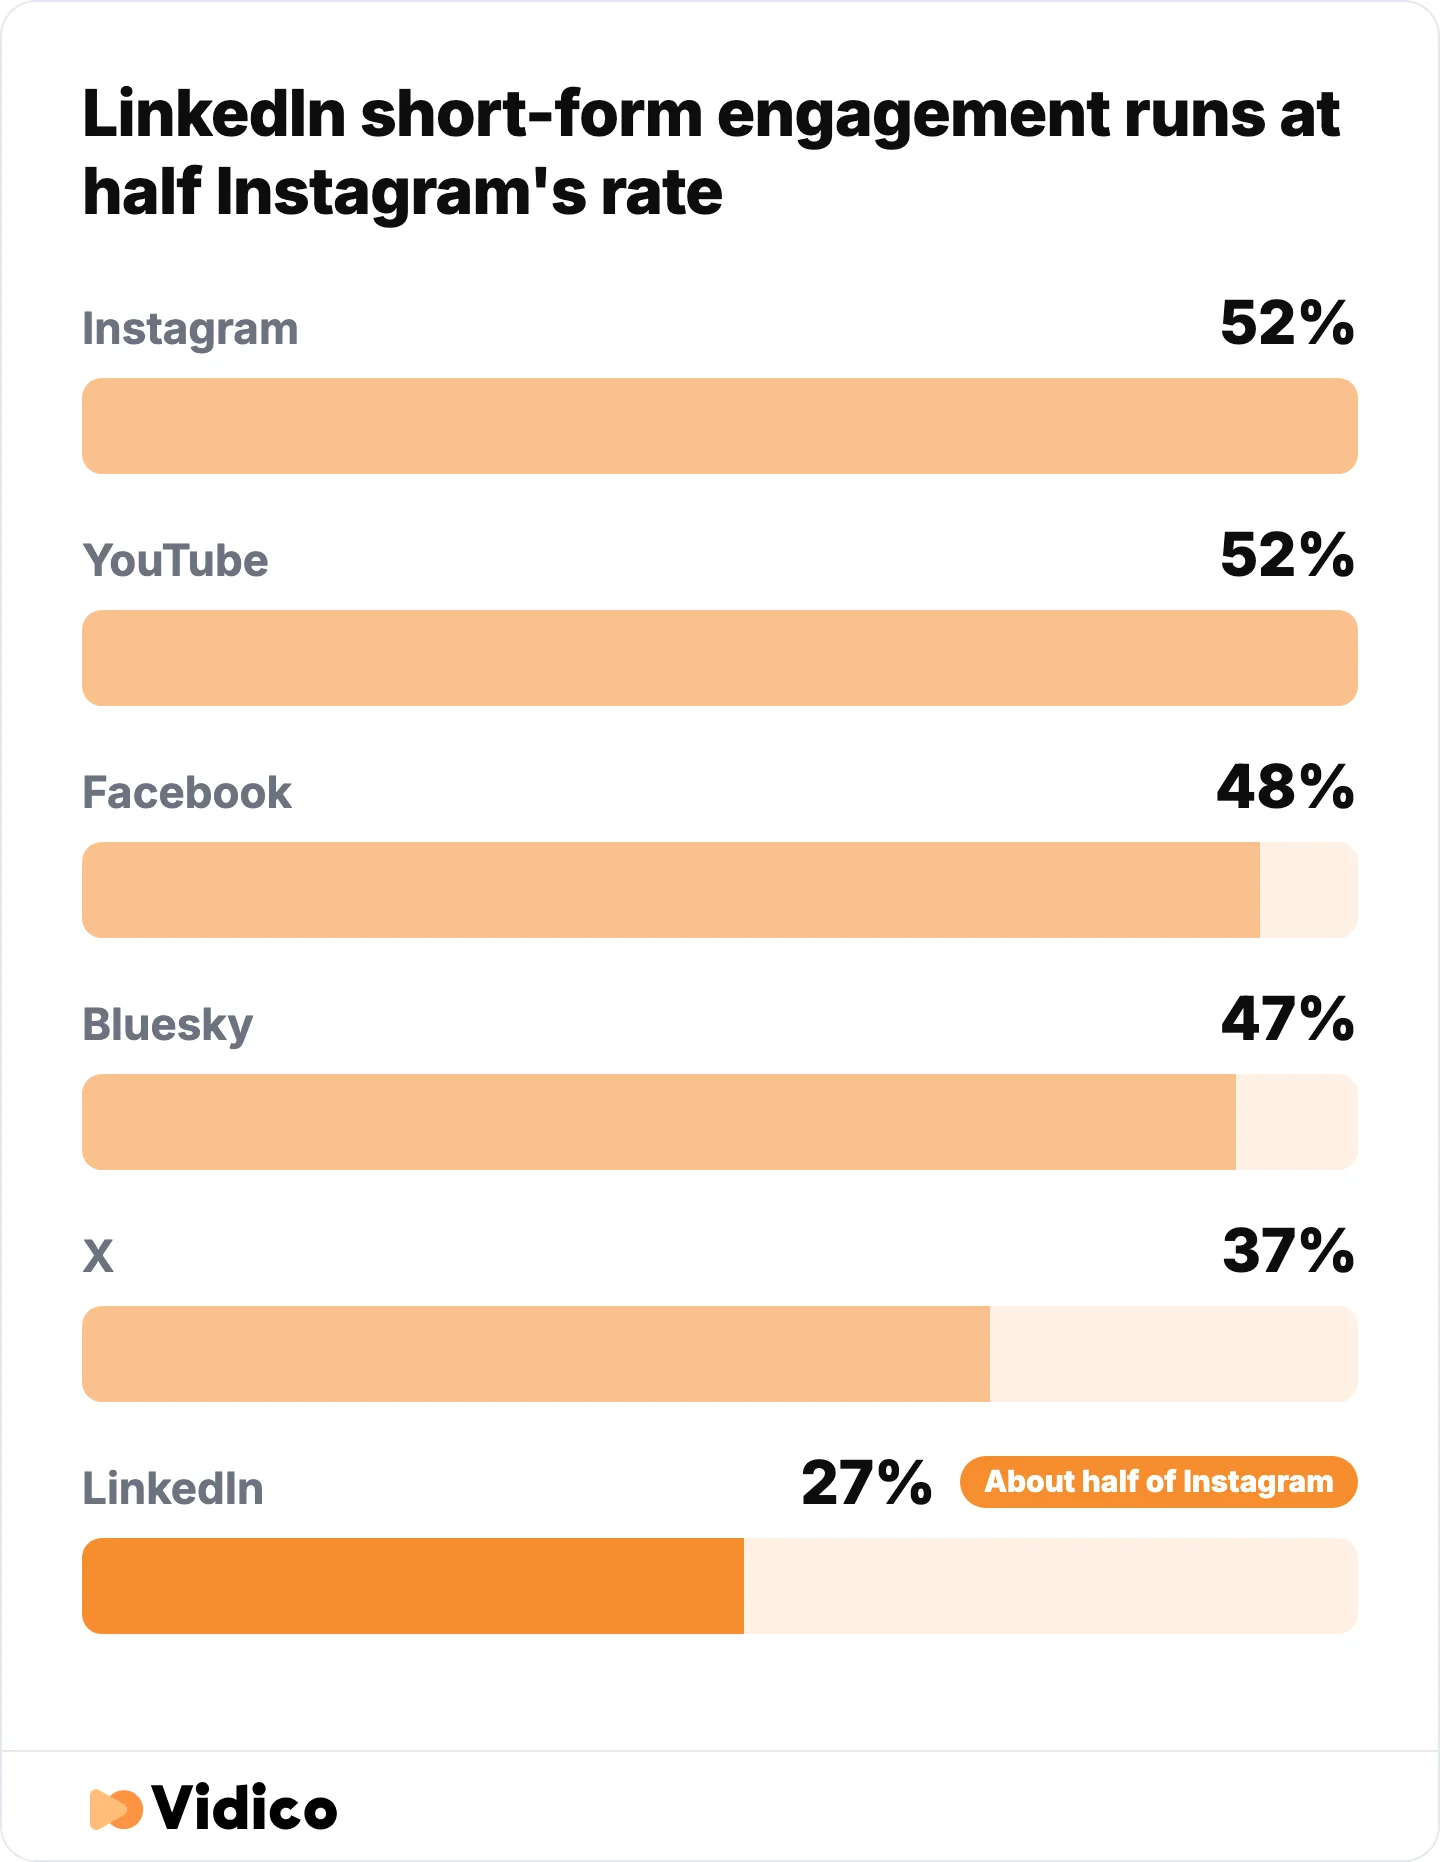
If your buyers are B2B, LinkedIn’s 27% matters more than any headline engagement number. Source: Sprout Social 2026 Content Strategy Report, US-weighted consumer survey on brand video under 60 seconds.
Ad Spend and Market Size
US digital video advertising passes $80 billion in 2026, and social video is now growing faster than connected TV for the first time.
- US digital video ad spend surpasses $80 billion in 2026, covering connected TV, social video and online video. IAB’s Digital Video Ad Spend and Strategy Report, produced with Advertiser Perceptions and Guideline and published May 2026. US. IAB states the figure as passing $80 billion rather than a precise total, so the more specific numbers circulating for this report come from secondary reporting rather than IAB itself.
- That represents 11% year-over-year growth, roughly 20% faster than the total advertising market. IAB. US.
- Social video is growing 13% against connected TV’s 11%, the first time social video has outpaced CTV. IAB. This is the strongest available evidence that budget is moving toward short-form specifically rather than digital video generally.
- Digital video passes 60% of all TV and video ad spend for the first time. IAB. US.
- Targeting rose 10 percentage points year over year as the top video investment criterion, and 23 points among small and mid-sized spenders. IAB. US.
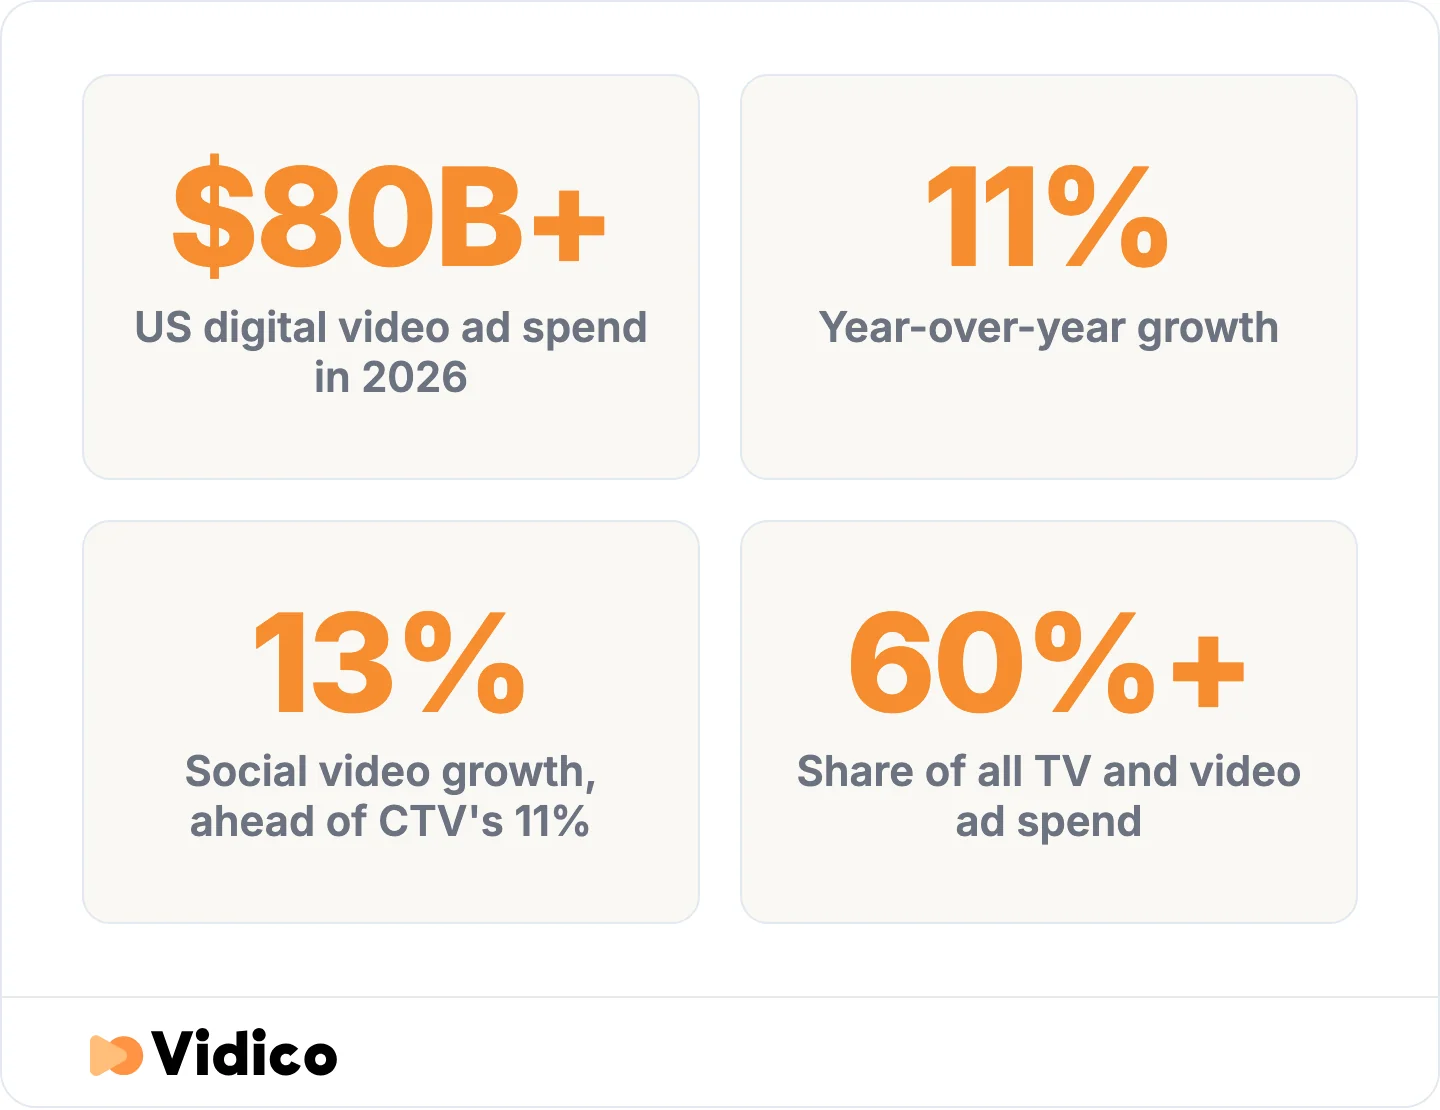
Budget is moving toward social video faster than connected TV for the first time. Source: IAB Digital Video Ad Spend and Strategy Report, produced with Advertiser Perceptions and Guideline, May 2026 (US).
Short-Form Video as a Discovery Engine
Short-form clips increasingly function as the top of the funnel for longer content, and this is the one area where the strongest available research is routinely misquoted.
YouGov’s study of short-form video and TV viewership is the only nationally representative survey with published methodology in this space. It was fielded online between 20 and 27 October 2025 among 2,035 Great Britain adults aged 16 and over, weighted to Office for National Statistics estimates, and published March 2026. All figures in this section are Great Britain, not the United States.
- 85% of 16 to 24 year olds watch short-form content at least weekly, against 45% of those 55 and over. YouGov. This is a consumption figure. It is frequently repeated as a claim about content discovery, which it is not.
- 69% of 16 to 24 year olds watch short-form video every day, against 18% of those 55 and over. YouGov.
- 77% of viewers who saw clips from a TV show or film on social went on to watch the full programme. YouGov. This is the actual discovery figure, and it is distinct from statistic 51.
- 87% of 16 to 24 year olds have started a full show or film after encountering clips or memes on social. YouGov.
- 49% of 16 to 24 year olds discover shows through social media, and 25% credit influencers or creators. YouGov.
- 55% of viewers overall say social platforms do not influence their viewing choices. YouGov. Short-form discovery is real and it is concentrated among younger viewers, not universal.
- 69% of 16 to 24 year olds have watched clips from a show instead of watching the full version. YouGov. Discovery and substitution are both happening at once.
- 43% of US adults under 30 regularly get news on TikTok, against 20% of all US adults, up from 9% in 2020. Pew Research Center, fielded August 2025. Pew notes that no social platform it has studied has grown faster as a news source. Among TikTok users specifically, 55% get news there.
- 62% of US adult TikTok users say they use it to look at product reviews or recommendations, rising to 74% among 18 to 29 year olds. Pew Research Center, fielded March 2024. Dated, but it remains the cleanest US figure on commercial discovery through short-form video.
- 66.6% of US consumers have used social search, meaning they have searched on at least one social platform. EMARKETER, fielded March 2025.
B2B and LinkedIn Short-Form Video
B2B video adoption is high, but short-form engagement on LinkedIn runs at roughly half Instagram’s rate, and B2B content research does not support the idea that short-form dominates the channel.
- 78% of B2B marketers already use video and 56% plan to increase their use. LinkedIn’s B2B Marketing Benchmark. Global B2B.
- B2B video objectives split across brand awareness at 35%, trust and credibility at 29%, and conversions or sales at 23%. LinkedIn’s B2B Marketing Benchmark. Awareness outranks conversion by a wide margin, which is worth remembering before judging a short-form programme on lead volume alone.
- 40% of B2B decision-makers say creative advertising makes them more likely to consider a purchase. LinkedIn with MAGNA Media Trials.
- Only 15% of B2B marketers use personalisation in video content, the lowest of any channel measured. The Content Marketing Institute, MarketingProfs and Storyblok 2026 B2B Content and Marketing Trends study, surveying 1,015 B2B marketers between June and August 2025.
Want to see where your short-form video sits against your category? Our Creative Intelligence Report breaks down what your competitors are publishing and what they are missing.
Five Widely-Repeated Stats That Don’t Hold Up
Four of the most-quoted statistics in short-form video marketing have no primary source, and a fifth rests on a forecast that stopped being published. We traced each one. If you have cited any of these, the traces below are what you need to correct the record.
“Viewers retain 95% of a message in video, against 10% when reading.” This traces to a marketing agency that has since published the origin itself: a small unpublished survey of around 200 B2B buyers conducted in the late 2000s, described by its own authors as directional rather than a peer-reviewed study. The “10% of what they read” half comes from a retention pyramid falsely attributed to educator Edgar Dale. The percentages were never in Dale’s work. They trace to unsourced 1967 figures later superimposed onto his diagram, as documented in The Mythical Retention Chart and the Corruption of Dale’s Cone of Experience in Educational Technology. Verdict: no primary source exists. Do not cite it.
“The brain processes visual information 60,000 times faster than text.” This traces to promotional brochures published by 3M in the 1990s and 2000s, citing unnamed behavioural research. There is no study, no author and no journal. The University of Minnesota attribution attached to it is a marketing artifact rather than a published paper, and the researcher most often name-checked has said his work had nothing to do with visual processing speed. Verdict: no study exists. We are not offering a replacement number, because no peer-reviewed work quantifies this ratio at all.
“Video is over 82% of all global internet traffic.” This comes from Cisco’s Visual Networking Index, a forecast series Cisco discontinued, whose final projection ran only to 2023. It is a dead forecast rather than a measurement. The live measured equivalent: video accounted for around 75% of all mobile data traffic at the end of 2025, per the Ericsson Mobility Report. Ericsson separately reports that social media video makes up roughly 80% of all video traffic on three of four sampled operator networks, with streaming video-on-demand under 10% of mobile video traffic on smartphones. Verdict: replace, and note that these are mobile figures, not all internet traffic. Getting that denominator wrong is the original error.
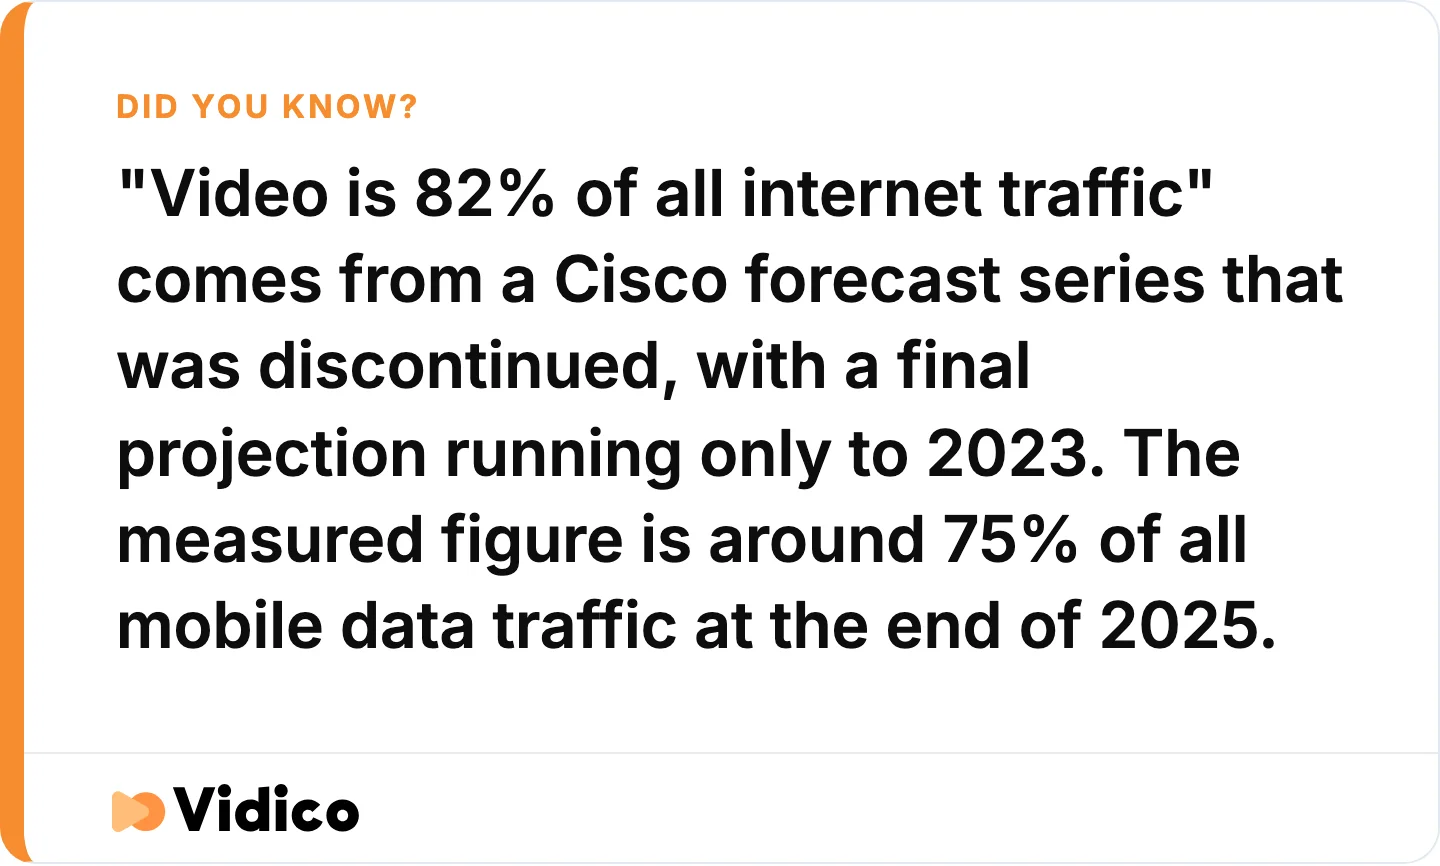
The “82% of all internet traffic” number is a dead forecast, not a measurement, and the real figure has a different denominator. Sources: Cisco Visual Networking Index (discontinued) and the Ericsson Mobility Report.
“TikTok holds around 40% of the short-form video market.” Every page carrying this figure attributes it to Statista without a dataset, a URL or a methodology, and no underlying dataset surfaced across four search approaches. The claim is also incoherent as stated, because market share of what is never specified: users, time, views or revenue. TikTok, Reels and Shorts have heavily overlapping user bases, so a mutually exclusive share split is not a meaningful measure without a stated metric. Verdict: unsourced and structurally unsound. Use a figure with a real denominator instead, such as Shorts averaging 200 billion daily views (statistic 23) or Reels’ $50 billion run rate (statistic 30).
“People watch 1 hour 16 minutes of short-form video daily.” A closed loop of roundup pages citing each other or citing nothing. No survey, no panel, no methodology, no original publisher. A competing 80-minute figure circulates with equally absent sourcing. Verdict: no source exists. Use the 58% share of social media time (statistic 1) instead, which comes from measured app data.
Two more claims worth flagging: “91% of businesses use video as a marketing tool” traces to a single vendor survey and has no second source, so we have used LinkedIn’s 78% B2B adoption figure (statistic 61) instead. “85% of videos are watched without sound” originates from a 2016 trade article in which two individual publishers self-reported the number, with a third reporting a 50% to 80% range in the same piece. No platform has ever released sound-on data.
What B2B Teams Should Take From This
Consumer data shows short-form video winning on almost every measure. B2B marketing leaders report something more complicated, and on one point they contradict the consensus in this category outright.
In Vidico’s 2026 State of Creative Marketing in Tech report, a survey of more than 230 B2B tech marketing leaders, mid-form video came out as the leading content format, by a slim margin over short-form. Every ranking page on this topic asserts short-form dominance without qualification. Among B2B tech marketers specifically, the picture is closer than that. The same survey found paid social video and customer-proof video tied as the highest-impact formats for 2026.
Vidico’s 2026 State of Creative Marketing in Tech report surfaced three further findings that line up with the third-party research on this page:
- 76% say their creative production budget is growing this year, and 74% say total marketing budget is growing. That matches the direction of IAB’s US ad spend figures rather than contradicting them.
- 65% run structured creative experimentation at least monthly. The most-tested variables are audience or segment at 44.9%, message angle at 39.3%, and the hook or opening at 38.0%. That last number is the practitioner answer to the six-second attention data in statistic 20.
- Most teams take 4 to 14 days from concept to live, while teams with reusable template systems ship in 1 to 3 days. Only one in three has a fully reusable asset system.
Read alongside the market data, a genuine tension emerges that no other page on this topic acknowledges. Consumer engagement clearly favours short video. But Wistia’s data shows longer videos earn more clicks (statistic 17), Vidyard’s shows completion collapsing with length rather than value collapsing (statistic 15), LinkedIn short-form engagement runs at half Instagram’s rate (statistic 40), and B2B content research does not rank video among its top investment categories at all. For a B2B audience, “short-form wins” is too blunt a conclusion to act on.
At Vidico, we produce explainer video and short-form video for B2B tech and SaaS brands, and the pattern we build against is the one this survey describes: reusable template systems that let a team ship in days rather than weeks. Working that way with TikTok’s marketing team produced a 400% increase in creative output.
How We Verified These Statistics
Every figure on this page was traced to the organisation that produced it, not to a page repeating it. Where a claim could only be traced to another roundup, we cut it.
- Primary sources only. Where a statistic appears in a report, we cite the report’s publisher and link the page carrying the figure. Where it comes from an earnings call, we link the transcript.
- Year and geography on every figure. A US-only number labelled as global is one of the most common errors in this category, and we have flagged every non-US source in place.
- Sample sizes where publishers disclose them. Most short-form video statistics circulate with no sample size at all.
- Nothing published on trust. Eight widely-circulated claims were checked and cut this round. Five are documented above with their traces.
- No competitor sourcing. Statistics that could only be traced to a competing agency’s blog were re-sourced to a neutral authority or dropped.
Figures marked as dated are included where no newer equivalent exists, with the year stated in the body so you can judge them.
FAQs
What counts as short-form video?
Short-form video is vertical video running roughly 60 seconds or less, designed for TikTok, Instagram Reels, YouTube Shorts and Facebook Reels. The boundary is not fixed. Wistia measures engagement in an “under one minute” band, Sprout Social’s consumer research uses “under 60 seconds,” and the average TikTok upload runs 42.7 seconds. Anything past about two minutes is generally treated as mid-form.
How many people watch short-form video?
Short-form video takes 58% of all time spent on social media worldwide, and 94.6% of online adults watched online video in the past 30 days, according to DataReportal’s Digital 2026 report. In the US, 84% of adults have used YouTube and 37% have used TikTok, per Pew Research Center. Daily use skews sharply young: about 50% of US adults aged 18 to 29 visit TikTok daily, against 5% of those 65 and over.
Is short-form video actually effective for marketing?
Marketers rank it first for return on investment, at 49% against 29% for long-form video, according to HubSpot’s State of Marketing Report 2026. The strongest measured evidence comes from YouTube Shorts, where a Google and Kantar meta-analysis across 20 campaigns and 5,802 respondents found an 8.8% lift in purchase intent. The caveat is platform-dependent: short-form brand video engagement runs 52% on Instagram but 27% on LinkedIn, per Sprout Social, so effectiveness depends heavily on where your buyers are.
What is the ideal length for a short-form video?
Videos under one minute hold a 52% engagement rate, meaning viewers watch just over half the runtime, per Wistia’s 2026 State of Video Report. For business video specifically, 65% of viewers finish videos under a minute against 20% for videos over 20 minutes, per Vidyard. The trade-off is that videos between 5 and 30 minutes earn a 9% click-through rate on interactive elements, so shorter video wins attention while longer video wins action.
How much do the first few seconds matter?
TikTok Marketing Science, working with Kantar across 3,500 ads, found 90% of ad recall impact is captured within the first six seconds. That analysis covered ads running in 2021 and published in 2022, so treat it as directional. Practitioner behaviour points the same way: in Vidico’s 2026 State of Creative report, 38.0% of B2B tech marketers named the hook or opening as one of their most-tested creative variables.
Which platform should B2B teams prioritise for short-form video?
For B2B, the reach and engagement numbers point in different directions. LinkedIn draws the lowest short-form brand video engagement of any major platform at 27%, roughly half Instagram’s 52%, per Sprout Social. But 81% of video teams distribute on LinkedIn, per Wistia, and 78% of B2B marketers already use video, per LinkedIn’s own benchmark. The practical read is that LinkedIn is where B2B video gets distributed rather than where it gets the highest engagement rate, and expecting consumer-platform engagement from it will make a working programme look broken.
Are short-form video statistics reliable?
Frequently not. When we reviewed the pages ranking for this keyword, the one in first place carried 97 statistics with no outbound citations. Several of the most-repeated figures in this category, including the 95% retention claim, the 60,000 times faster claim and the 82% of internet traffic claim, have no primary source or rest on a discontinued forecast. Before citing a short-form video statistic, check whether the page names a publisher, a year and a sample size. Most do not.
Related Video Research
Short-form video sits inside a wider set of video marketing benchmarks. These pages carry the platform-level and format-level data that does not fit here.
- Video marketing statistics covers the full video marketing picture, including budget and channel data
- TikTok statistics and Instagram Reels statistics go deeper on each platform
- YouTube marketing statistics covers Shorts alongside long-form YouTube
- B2B video marketing statistics and LinkedIn video statistics focus on the B2B channel specifically
- Short-form video statistics for Australia covers the AU market
The Bottom Line
Short-form video takes the majority of social media time and ranks first among marketers for return on investment. Those two facts are well-sourced and hold up. Most of what surrounds them in this category does not.
The more useful read for a B2B team is the tension underneath the headline. Short video wins on the share of runtime watched, longer video wins on clicks, LinkedIn engagement runs at half Instagram’s rate, and B2B marketing leaders in our own survey put mid-form video narrowly ahead of short-form. A short-form programme built on the assumption that shorter is simply better will underperform against one built on where a specific audience actually is and what it does next.
Vidico is a B2B explainer video company, and short-form production for SaaS and tech marketing teams is core to what we ship. The constraint we see most often is not creative quality but production throughput. Teams with reusable template systems ship in 1 to 3 days against the 4 to 14 days most teams report, which is the difference between testing hooks weekly and testing them quarterly. Square’s programme with us runs at 200 or more assets a month across 200 markets on that model. If you want to see how your own short-form output compares, our short-form video production work is built around exactly that problem.
Sources
- DataReportal: Digital Global Overview Report
- DataReportal: Digital, The United States of America
- DataReportal: Global Social Media Statistics
- Pew Research Center: Americans’ Social Media Use
- Pew Research Center: 1 in 5 Americans Now Regularly Get News on TikTok
- Pew Research Center: A Majority of US TikTok Users Are There for Reviews and Recommendations
- EMARKETER: US Time Spent With Social Networks
- EMARKETER: US Digital Habits by Generation
- EMARKETER: US Time Spent With Media
- EMARKETER: Social Search Usage Trends
- Wistia: State of Video Report, Optimal Video Length
- Wistia: Video Marketing Statistics
- Vidyard: Video in Business Benchmark Report
- Statista: Average TikTok Video Duration
- TikTok for Business: Creative Best Practices for Top-Performing Ads
- TikTok Newsroom: Thanks a Billion
- YouTube Official Blog: The Future of YouTube
- YouTube Official Blog: Neal Mohan at Cannes Lions
- Nielsen: Media Distributor Gauge
- Meta Investor Relations: Third Quarter Earnings Call Transcript
- Meta Investor Relations: First Quarter Earnings Call Transcript
- HubSpot: Marketing Statistics and State of Marketing Report
- Sprout Social: Social Media Video Statistics
- Google: Advertising Experience on YouTube Shorts
- YouTube Ads: Shorts Ads
- IAB: US Digital Video Ad Spend to Surpass $80B
- YouGov: How Short-Form Video on Social Media Is Impacting TV Viewership
- Ofcom: Online Nation Report
- LinkedIn: B2B Insights, Video Controls the Conversation
- Content Marketing Institute: B2B Content Marketing Trends Research
- Ericsson: Mobility Report Mobile Traffic Update
- Ericsson: Short-Form Dominates Video Traffic
- Insivia: Why Does Video Convert Better Than Text
- ERIC: The Mythical Retention Chart and the Corruption of Dale’s Cone of Experience
- Digiday: A Silent World of Facebook Video