
Instagram Reels is the most-watched format on the app in 2026. Instagram has passed 3 billion monthly active users, more than 200 billion Reels are played every day across Meta’s apps, and in the US, Reels now account for nearly half of all time people spend inside the app. For brands, that is where the attention has moved.
The harder question is what actually performs. Reach is falling across every Instagram format while engagement patterns shift, the algorithm keeps changing what it rewards, and ad dollars are pouring into Reels faster than into any other placement. This report pulls together the current numbers, each one traced to a primary source, so you can plan around data instead of guesswork.
At Vidico, we produce short-form and social video for B2B teams, from SaaS companies to enterprise names like TikTok, Square, and Spotify. One short-form program we built lifted a brand’s content output by 400% and drove over 1 million organic views in five days, so the strategy notes here come from running these formats, not just reading about them.
Key Takeaways
- Reels own the attention, not the reach. Reels made up 46% of US time spent on Instagram in 2025, yet per-post reach fell across every format year over year. Winning now means completion and shares, not raw impressions.
- The “Reels get more engagement” claim depends on the study. A 35-million-post benchmark puts Reels at a 0.52% engagement rate, slightly below carousels. A separate study puts Reels well ahead at 1.23%. Both are real; the samples differ.
- Reels are Meta’s growth engine. More than half of all Instagram ads ran in Reels in 2025 (up from 35% a year earlier), and Reels now carry an annual ad run rate above $50 billion.
- Recency is a 2026 ranking lever. Same-day posts now make up more than 30% of recommended Reels, double a year ago, so posting cadence matters more than it used to.
- Shorter Reels still win discovery. Instagram pushes Reels under 90 seconds to non-followers, and watch time plus shares (sends) are the signals that move distribution.
30+ Instagram Reels Statistics for 2026
Reach and audience growth
-
Instagram has 3 billion monthly active users. Meta CEO Mark Zuckerberg confirmed the milestone in September 2025, per CNBC. That is roughly 1 billion added in under three years, and Reels are the format reaching most of them.
-
More than 200 billion Reels are played each day across Instagram and Facebook. Meta reported the figure in its Q2 2023 earnings, covered by Tubefilter; it remains the most recent official daily-plays number Meta has published.
-
Instagram’s daily active users grew about 2% year over year, led by Reels. CNBC, citing Sensor Tower data in January 2026, tied the increase directly to rising Reels usage.
-
Instagram ads reached 1.74 billion users as of early 2025, up 90.8 million year over year. That is a 5.5% annual increase in potential reach, according to DataReportal, with Reels the format driving much of that discovery.
-
Average reach per Instagram image post fell from 14,800 to 5,200 in a year. Statista reported the sharp decline across formats, which is why brands are shifting budget into video for discovery.
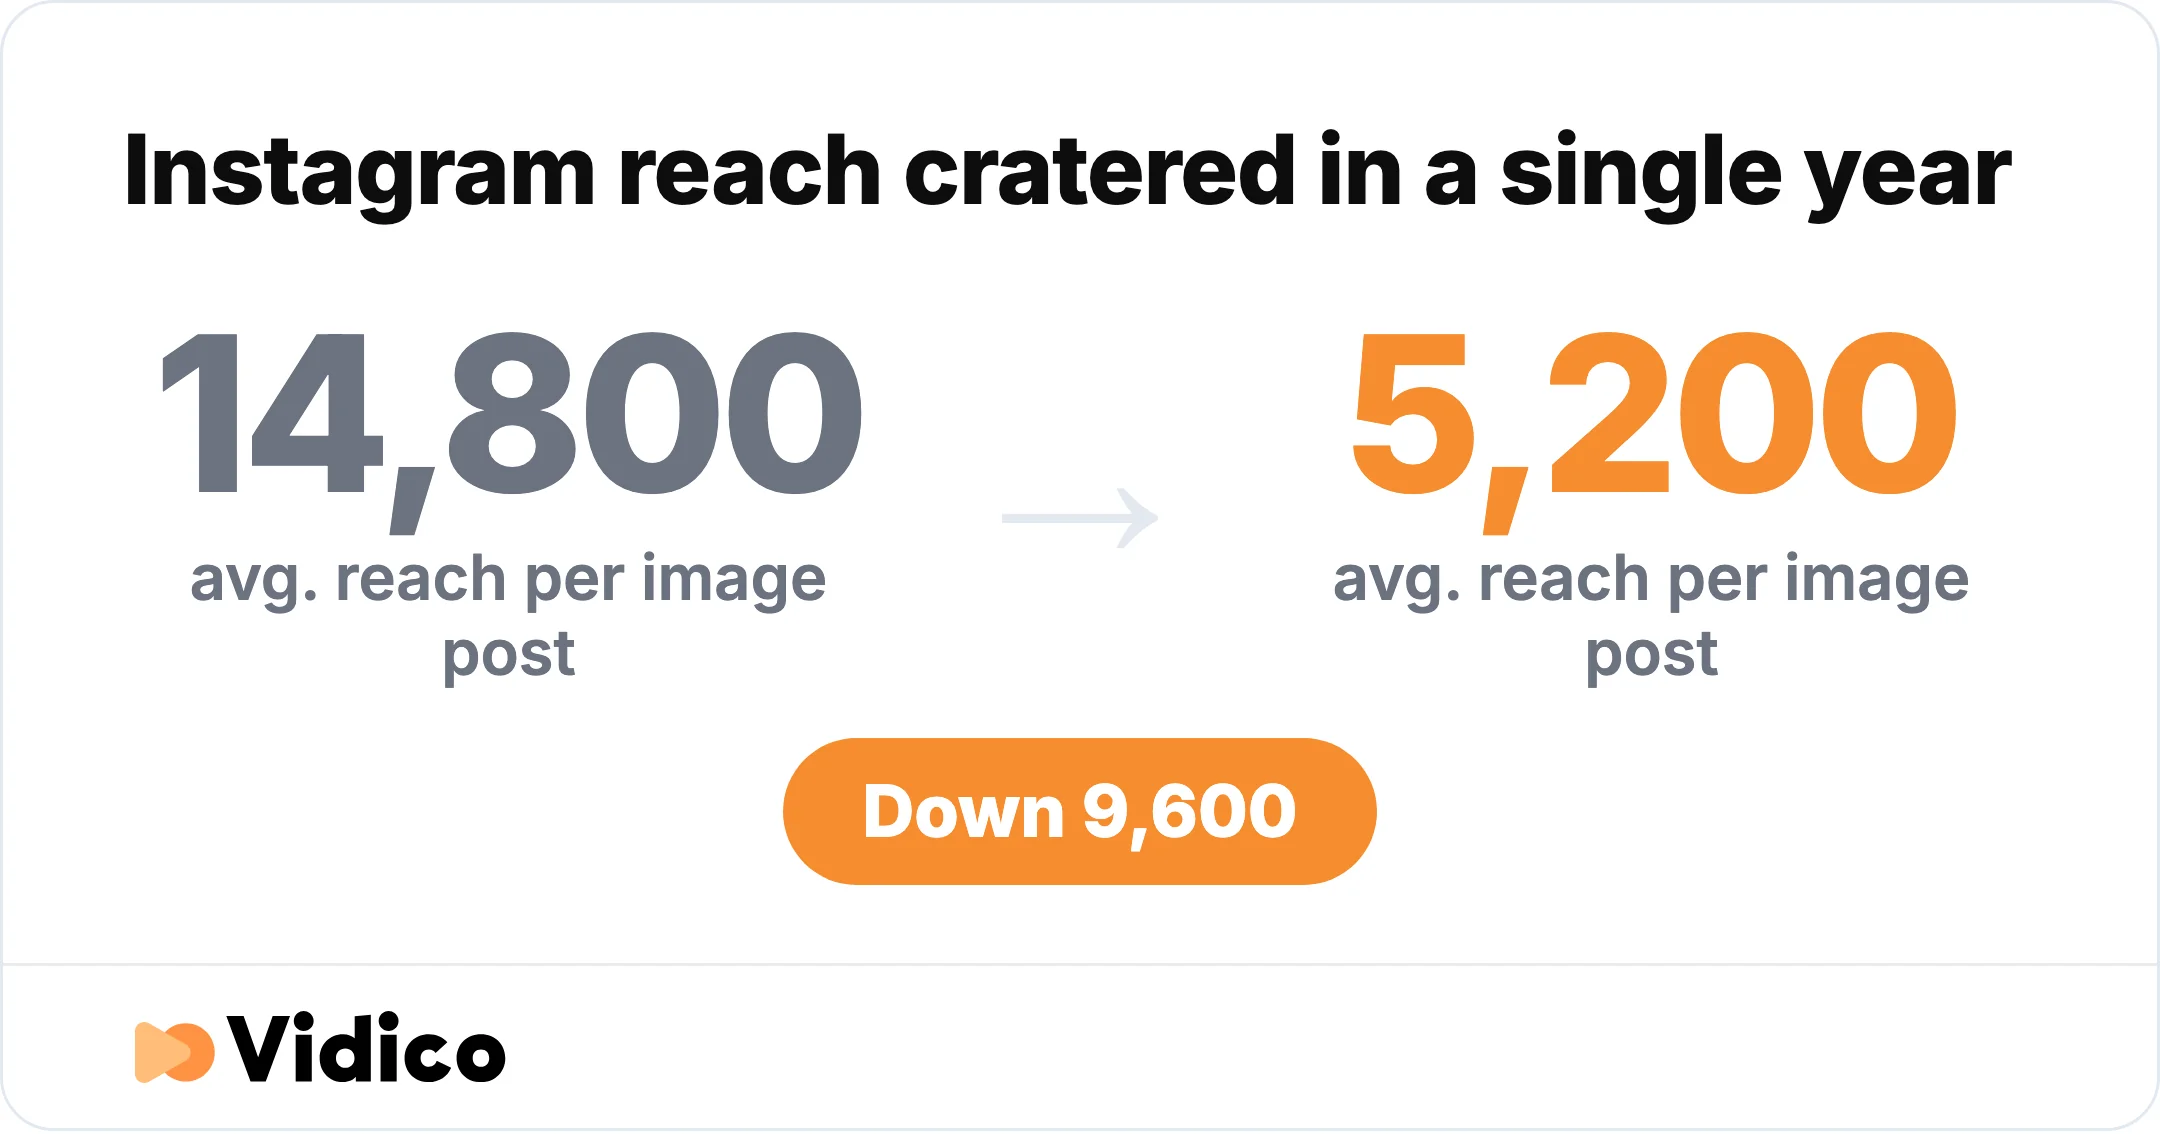
Average reach per Instagram image post nearly cratered in a year. Source: Statista.
- Reels see roughly 36% more reach than carousels and 125% more than single-image posts. Socialinsider benchmark data shows Reels remain the strongest format for getting in front of non-followers.
Engagement and performance benchmarks
- Reels average a 0.52% engagement rate, just behind carousels at 0.55% and ahead of images at 0.37%. This is the current large-sample figure from Socialinsider, based on 35 million posts across 447,613 profiles for full-year 2025, with overall Instagram engagement down about 24% year over year.
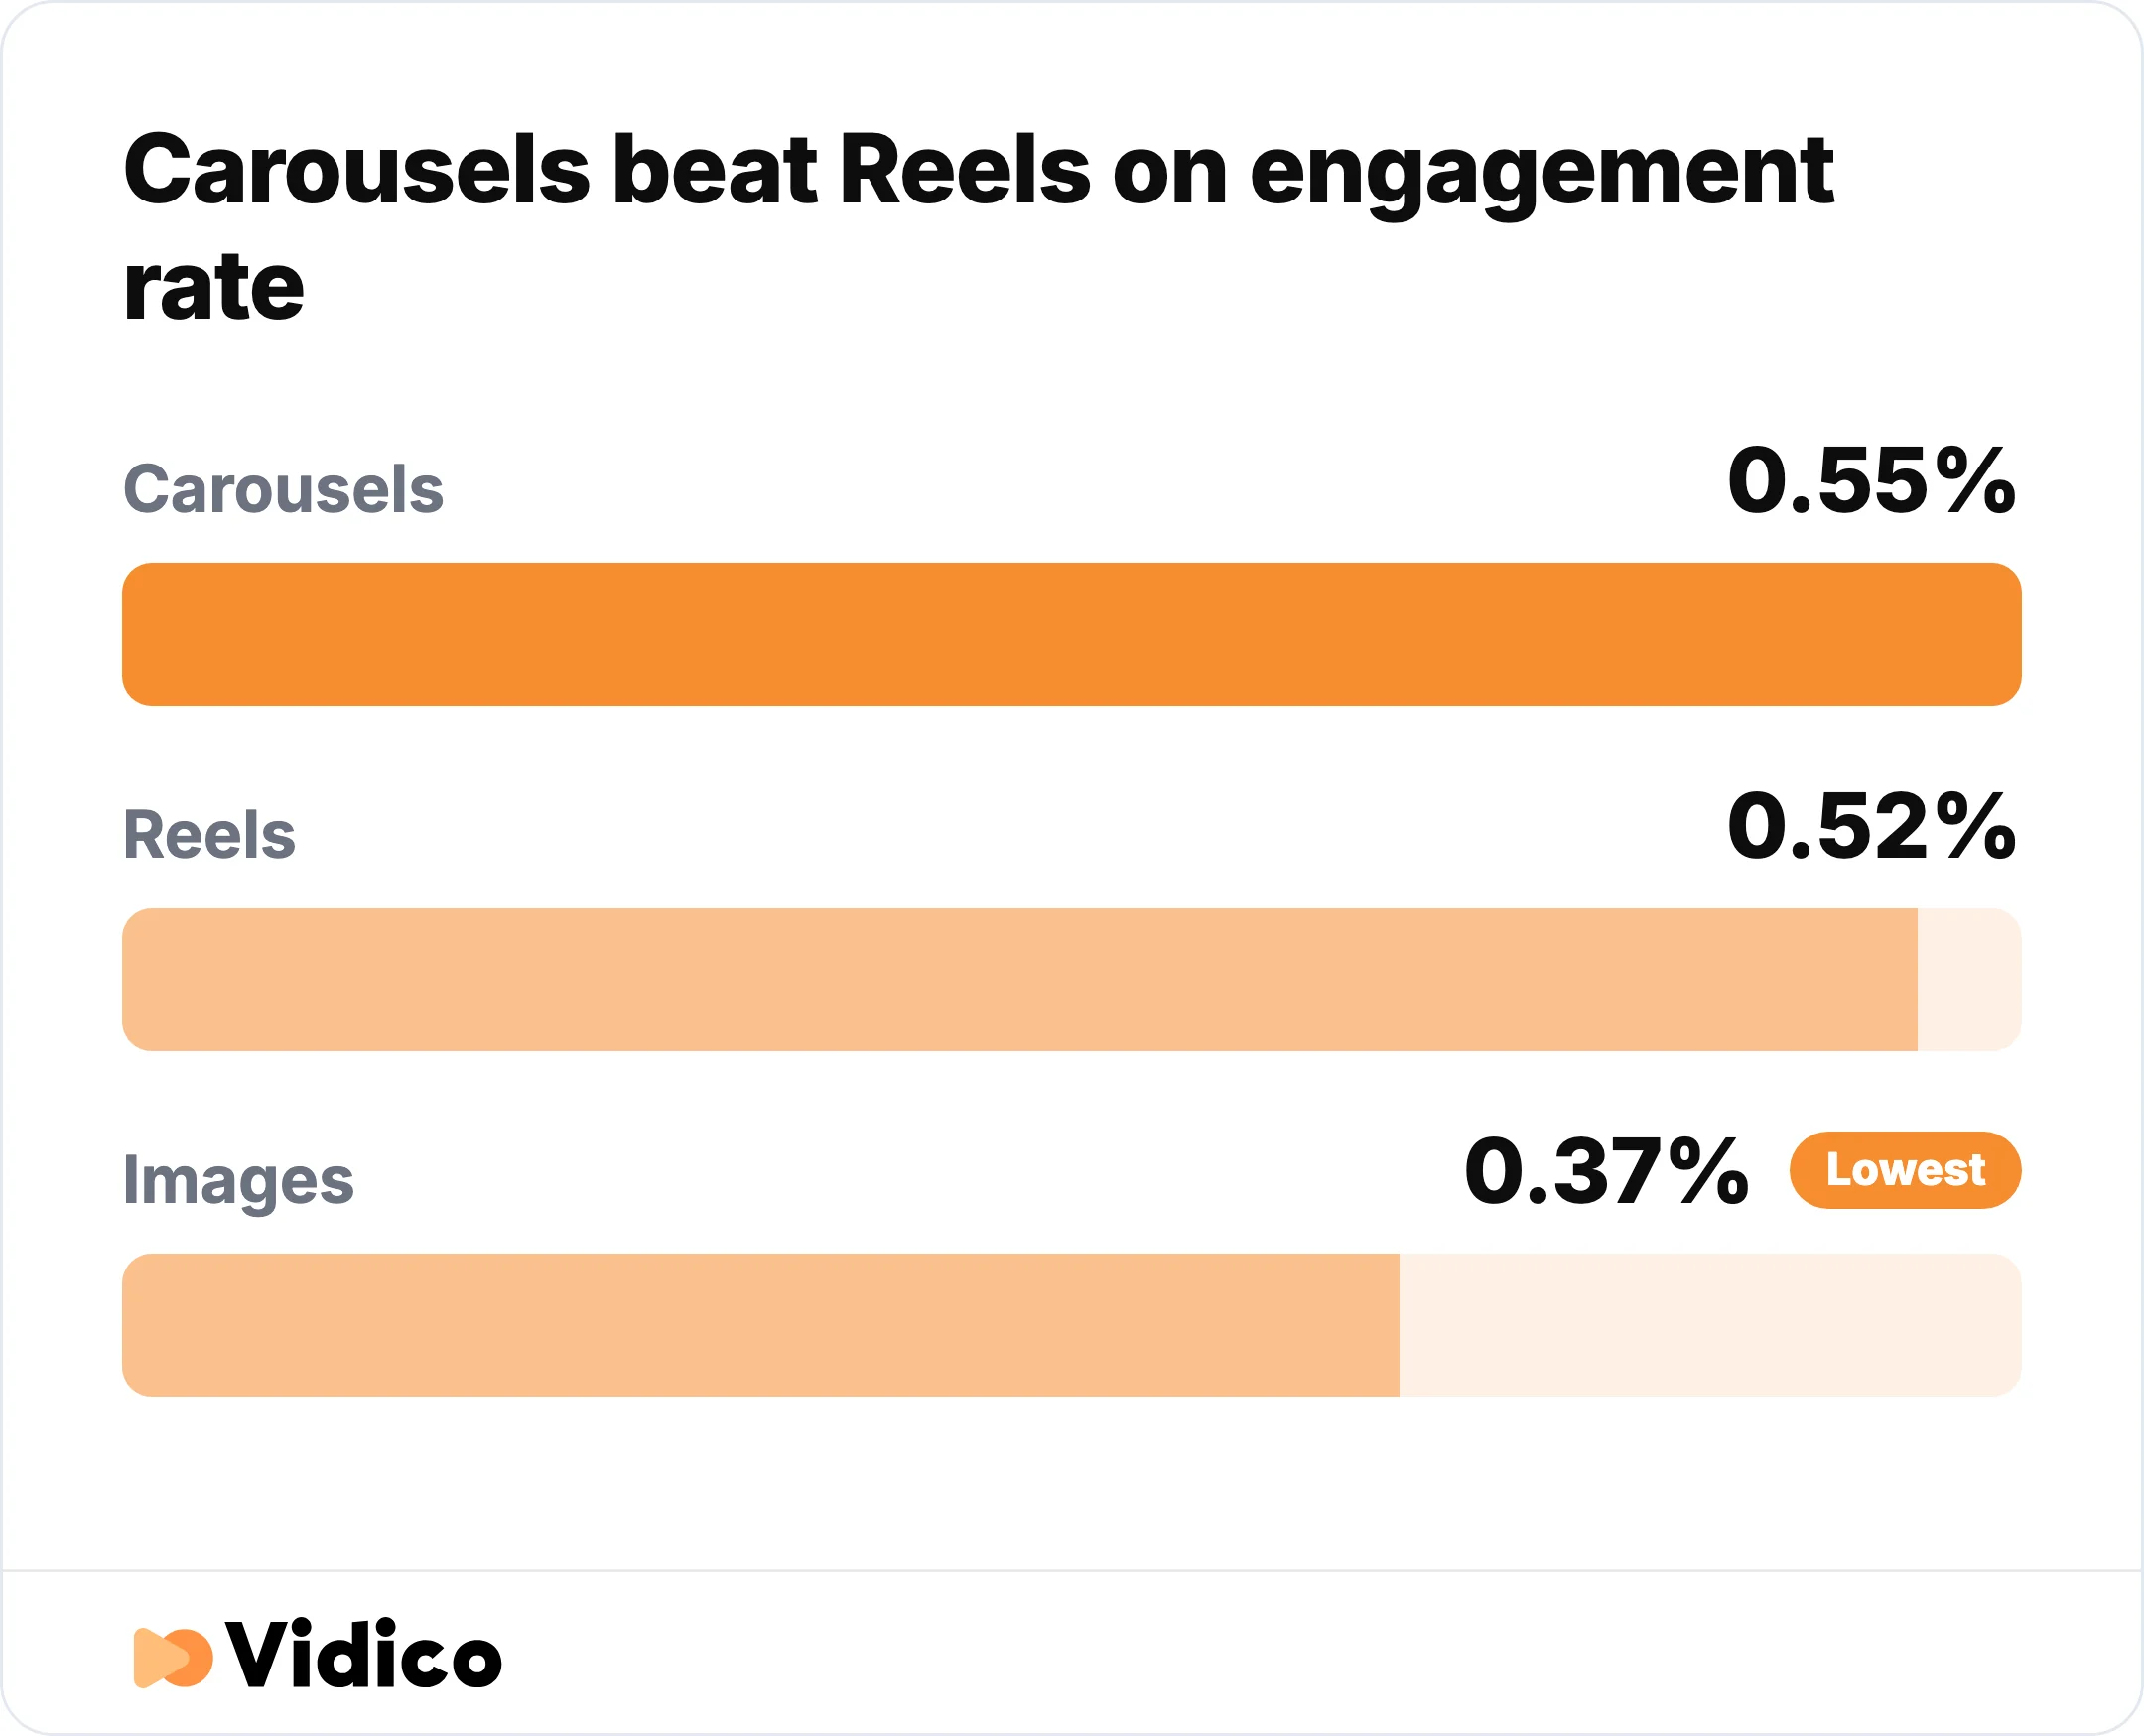
Reels don’t actually lead on engagement rate, carousels edge them out. Source: Socialinsider, 35 million posts, full-year 2025.
-
A separate study puts Reels engagement at 1.23%, above photos at 0.70% and carousels at 0.99%. Metricool reports this higher figure from a different sample. The gap is a reminder to check the methodology behind any single benchmark; Socialinsider’s larger, more recent dataset is the more conservative read.
-
The average Instagram Reel generates 283,000 views, 182,000 reach, 1,300 shares, and 618 saves. Dash Social pulled these figures from its own study of more than 3,300 global brands.
-
Reel engagement by industry ranges from 0.1% to 0.5%. Travel and media and entertainment sit at the top near 0.5%, while home and fashion sit near 0.1%, per Dash Social. Benchmark your Reels against your industry, not the platform average.
-
For accounts with 100,000 to 1 million followers, Reels average 16,035 views per post. Socialinsider found carousels (35,370) and images (22,900) can out-view Reels at that account size, so “Reels always win” is a myth for larger brands.
Reels ad revenue and monetization
-
More than half of all Instagram ads ran in Reels in 2025, up from 35% in 2024. CNBC, citing Sensor Tower, reported the shift, a sign of how completely Meta has committed to short-form ad inventory.
-
Reels carry an annual ad run rate above $50 billion. Zuckerberg announced the figure on Meta’s Q3 2025 earnings call, reported by Tubefilter. Short-form video has become central to Meta’s advertising business.
-
Instagram’s US ad revenue reached $37.13 billion in 2025, up 15.9%. eMarketer attributes the growth largely to Reels.
-
Instagram overtook Facebook to become the largest social ad business in the US in 2025. eMarketer credits Reels for pushing Instagram past its sibling app.
-
More than a quarter of Instagram’s ad revenue now comes from Reels and formats other than Feed or Stories. eMarketer’s 2025 analysis shows how quickly the revenue mix has tilted toward short-form.
-
Reels made up 21% of Instagram’s total ad impressions, up from 13% a year earlier. That is impression share, a narrower measure than the share of ad campaigns that include Reels, which now exceeds half. Tinuiti data reported by eMarketer tracks Reels as the platform’s fastest-growing ad placement.
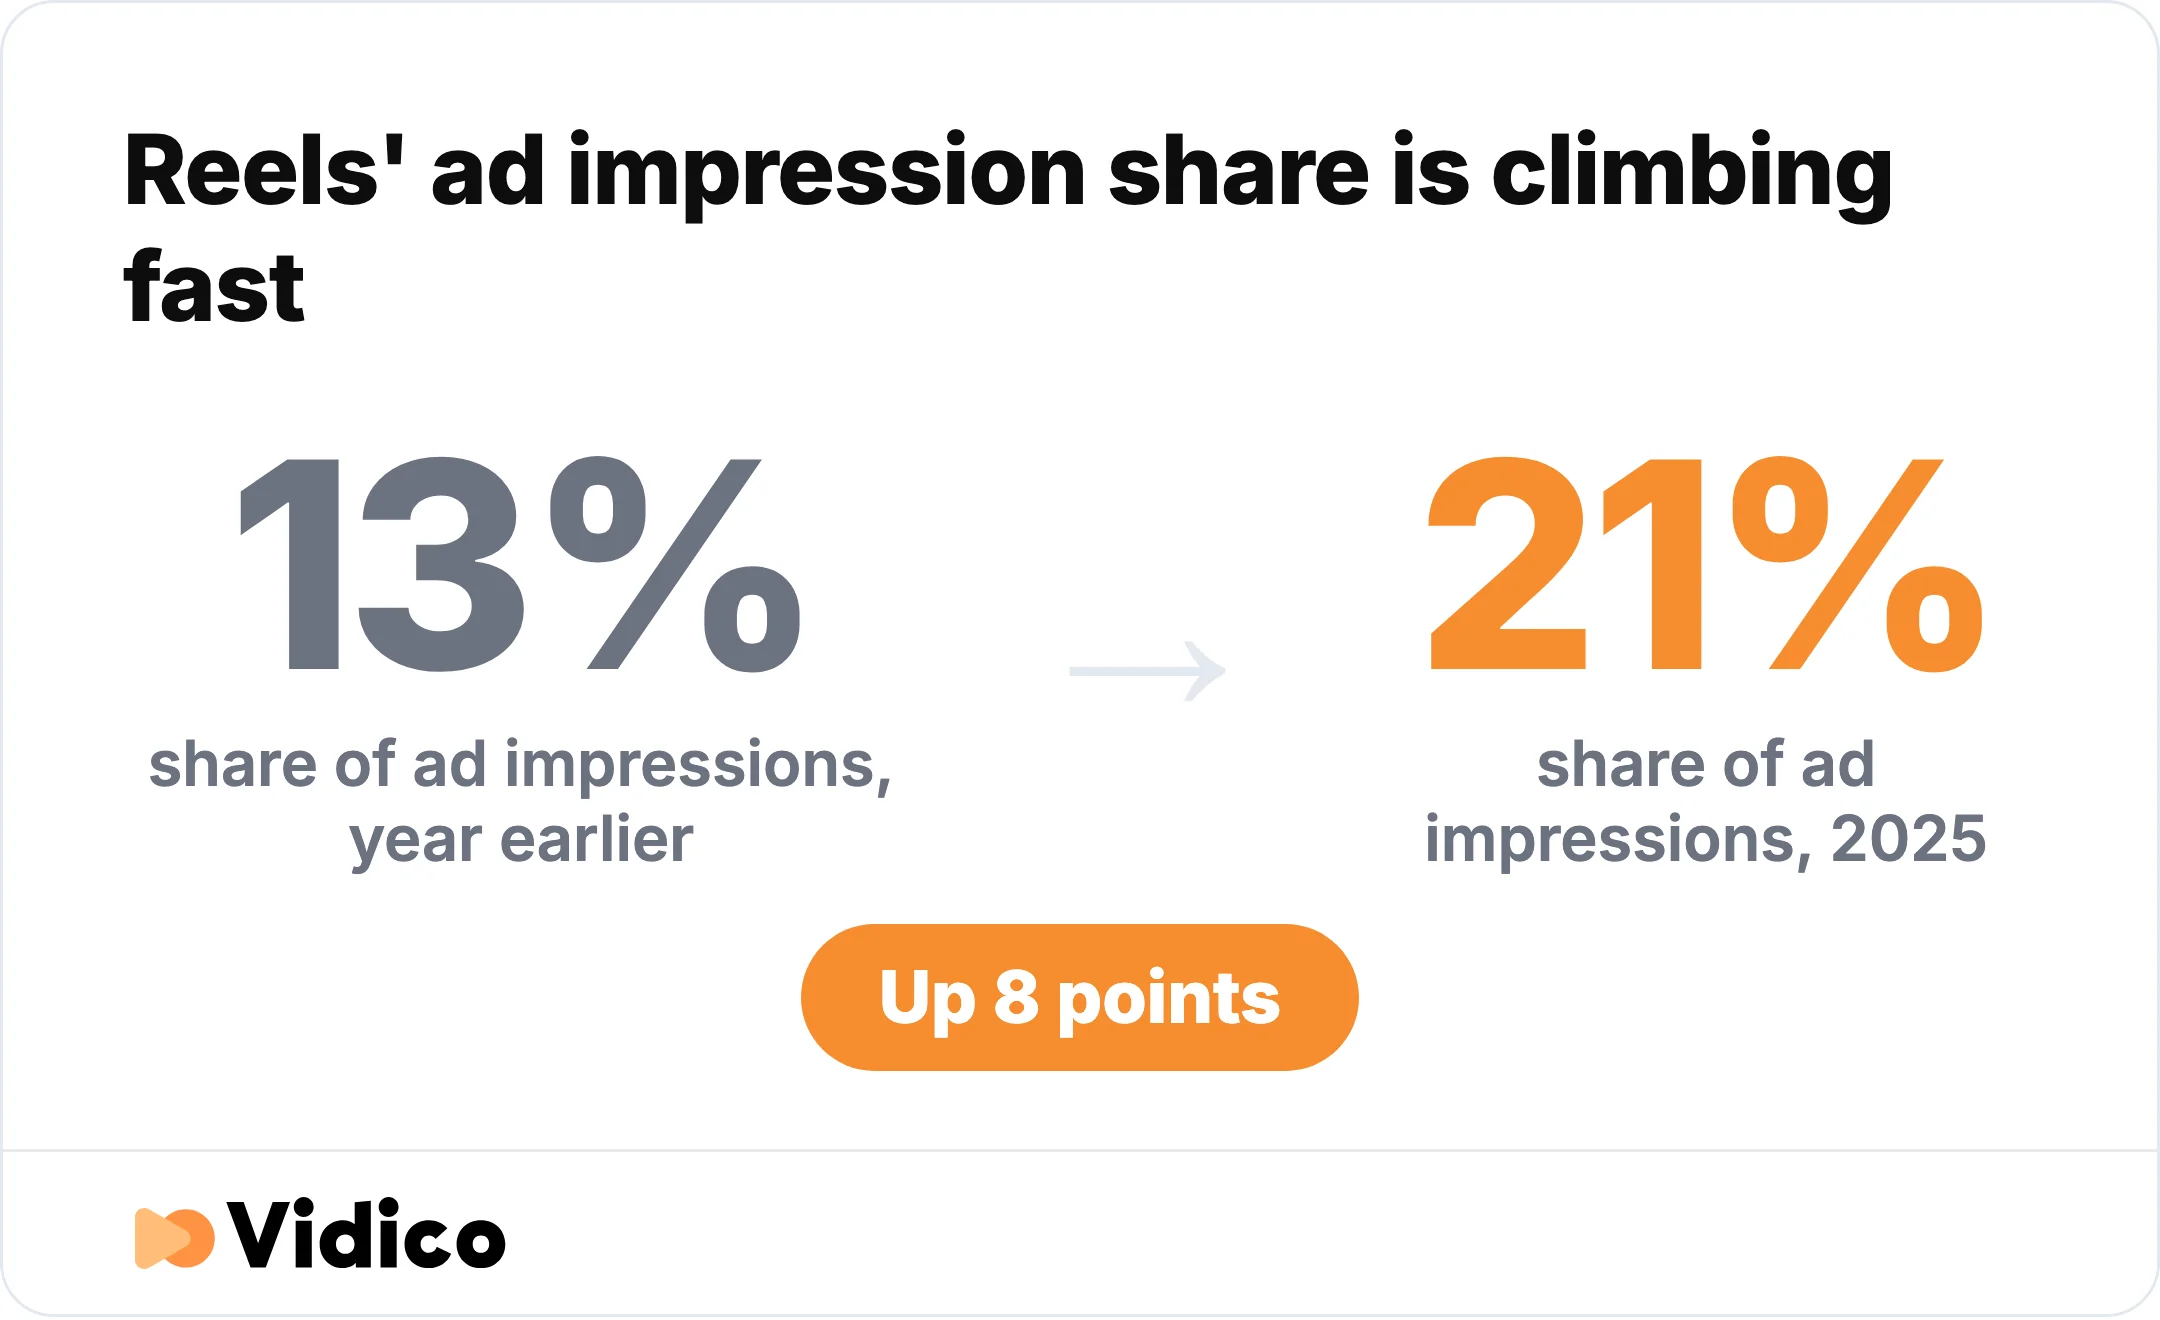
Reels are taking a bigger share of Instagram’s ad impressions each year. Source: Tinuiti data via eMarketer
- Instagram is projected to reach roughly $42.5 billion in US ad revenue in 2026. eMarketer expects Reels to keep driving the gains, with Instagram already generating more than half of Meta’s total ad revenue.
Algorithm and ranking signals
-
Instagram raised the maximum Reel length from 90 seconds to 3 minutes in January 2025. Instagram head Adam Mosseri announced the change, covered by Social Media Today. Shorter clips are still favored for non-follower reach.
-
Watch time, likes per reach, and sends per reach are the ranking signals that matter most. Per Mosseri, likes weigh more for followers and sends (DM shares) weigh more for non-followers, per Hootsuite’s algorithm guide. Track sends in Insights, not just likes.
-
Same-day posts now make up more than 30% of recommended Reels, double the level a year earlier. Meta shared the figure on its Q1 2026 earnings call, evidence that fresh, frequent posting earns a real distribution edge.
-
Q1 2026 ranking improvements drove a 10% lift in time spent on Reels. Meta reported the gain on the same earnings call, tied to better recommendation quality.
Time spent and viewing behavior
- Reels accounted for 46% of time spent on the Instagram app in the US in 2025, up from 37% in 2024. CNBC, citing Sensor Tower, notes Facebook Reels reached 29% of app time. Nearly half of every Instagram minute now goes to short-form video.
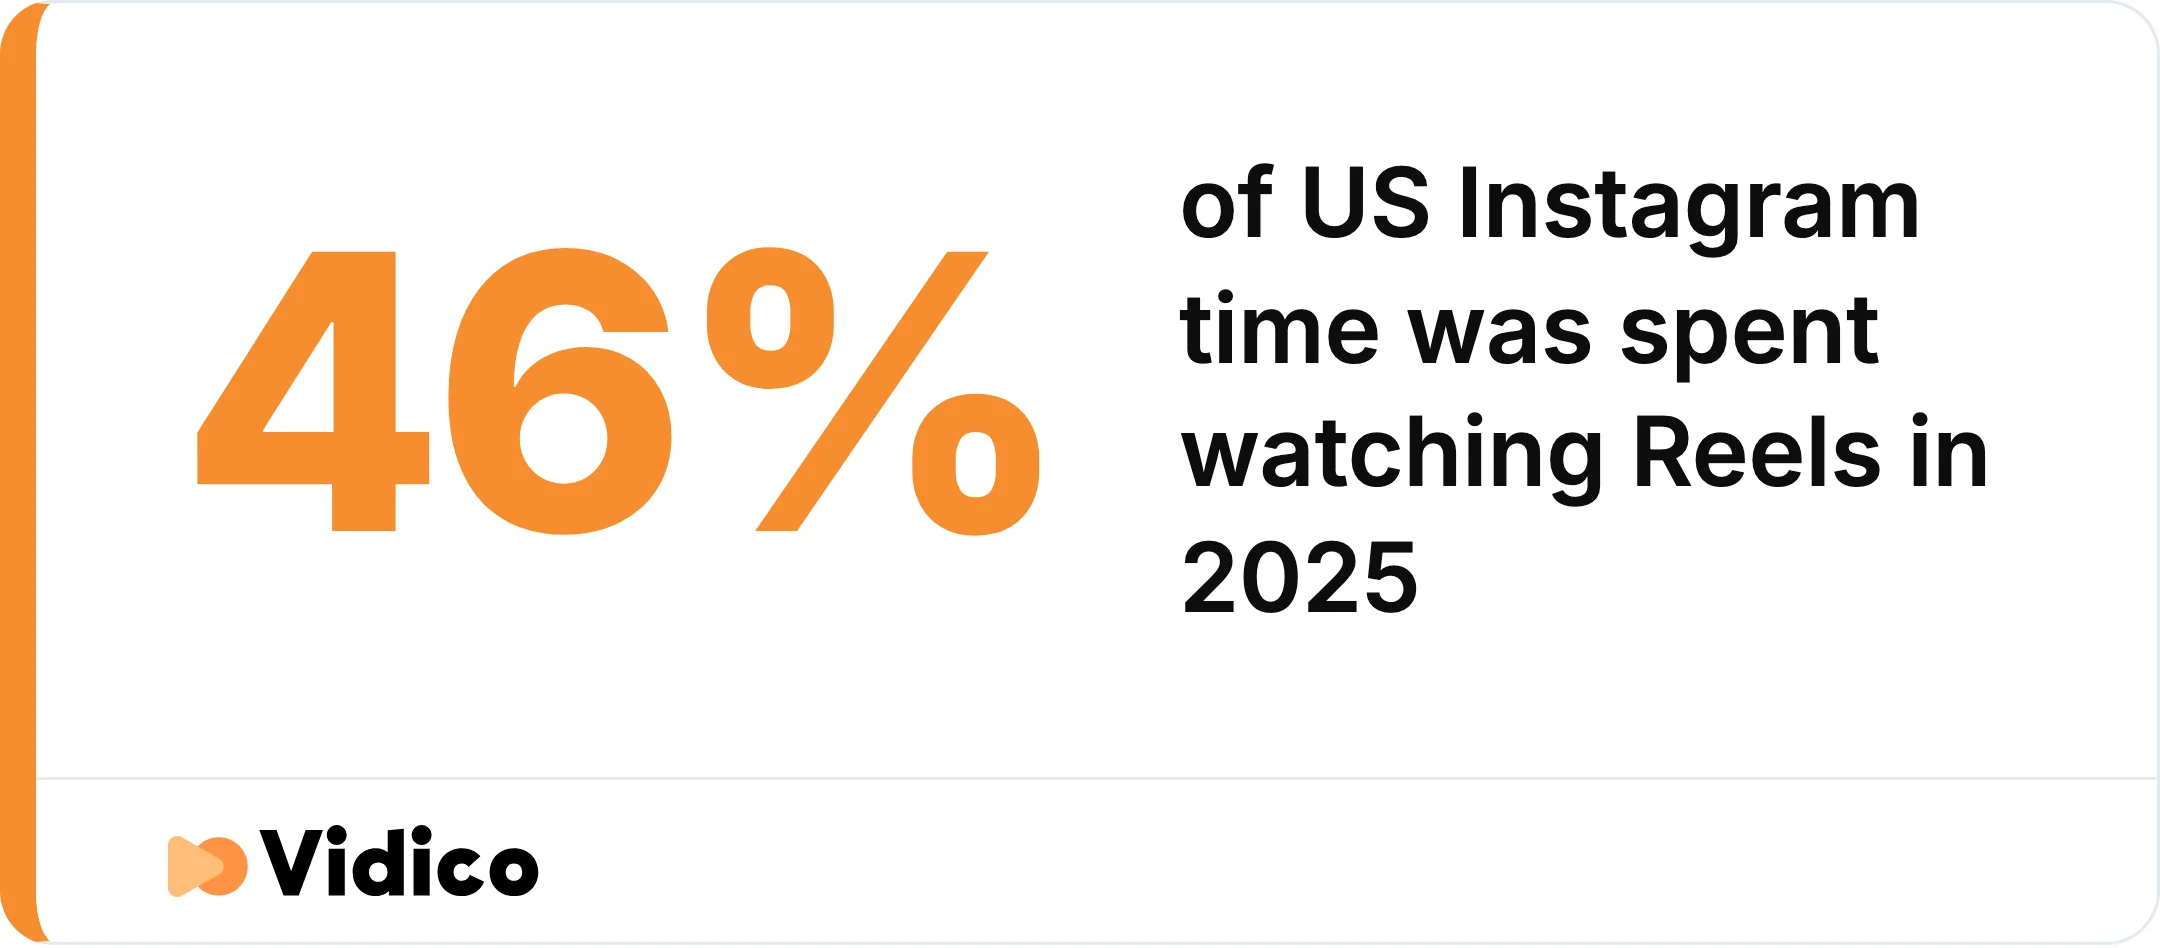
Reels now account for nearly half of every minute spent on Instagram in the US. Source: Sensor Tower via CNBC.
-
Total Facebook video time grew more than 8% globally in Q1 2026, the largest quarter-over-quarter gain in four years. Meta reported the jump on its Q1 2026 earnings call, driven by Reels and recommendations.
-
More than 500 million people watch AI-translated videos each week on Facebook and on Instagram. Meta shared the adoption figure on its Q1 2026 earnings call, a signal that localization is scaling short-form reach across markets.
-
Reels are reshared more than 4.5 billion times per day. Hootsuite reports the Meta figure, which is why shareable, save-worthy content beats vanity metrics for distribution.
Instagram audience demographics
- 80% of US adults aged 18 to 29 use Instagram. Usage falls to 62% for ages 30 to 49, 40% for 50 to 64, and 19% for 65 and older, according to Pew Research Center. Reels’ short, fast format maps to the platform’s younger core.
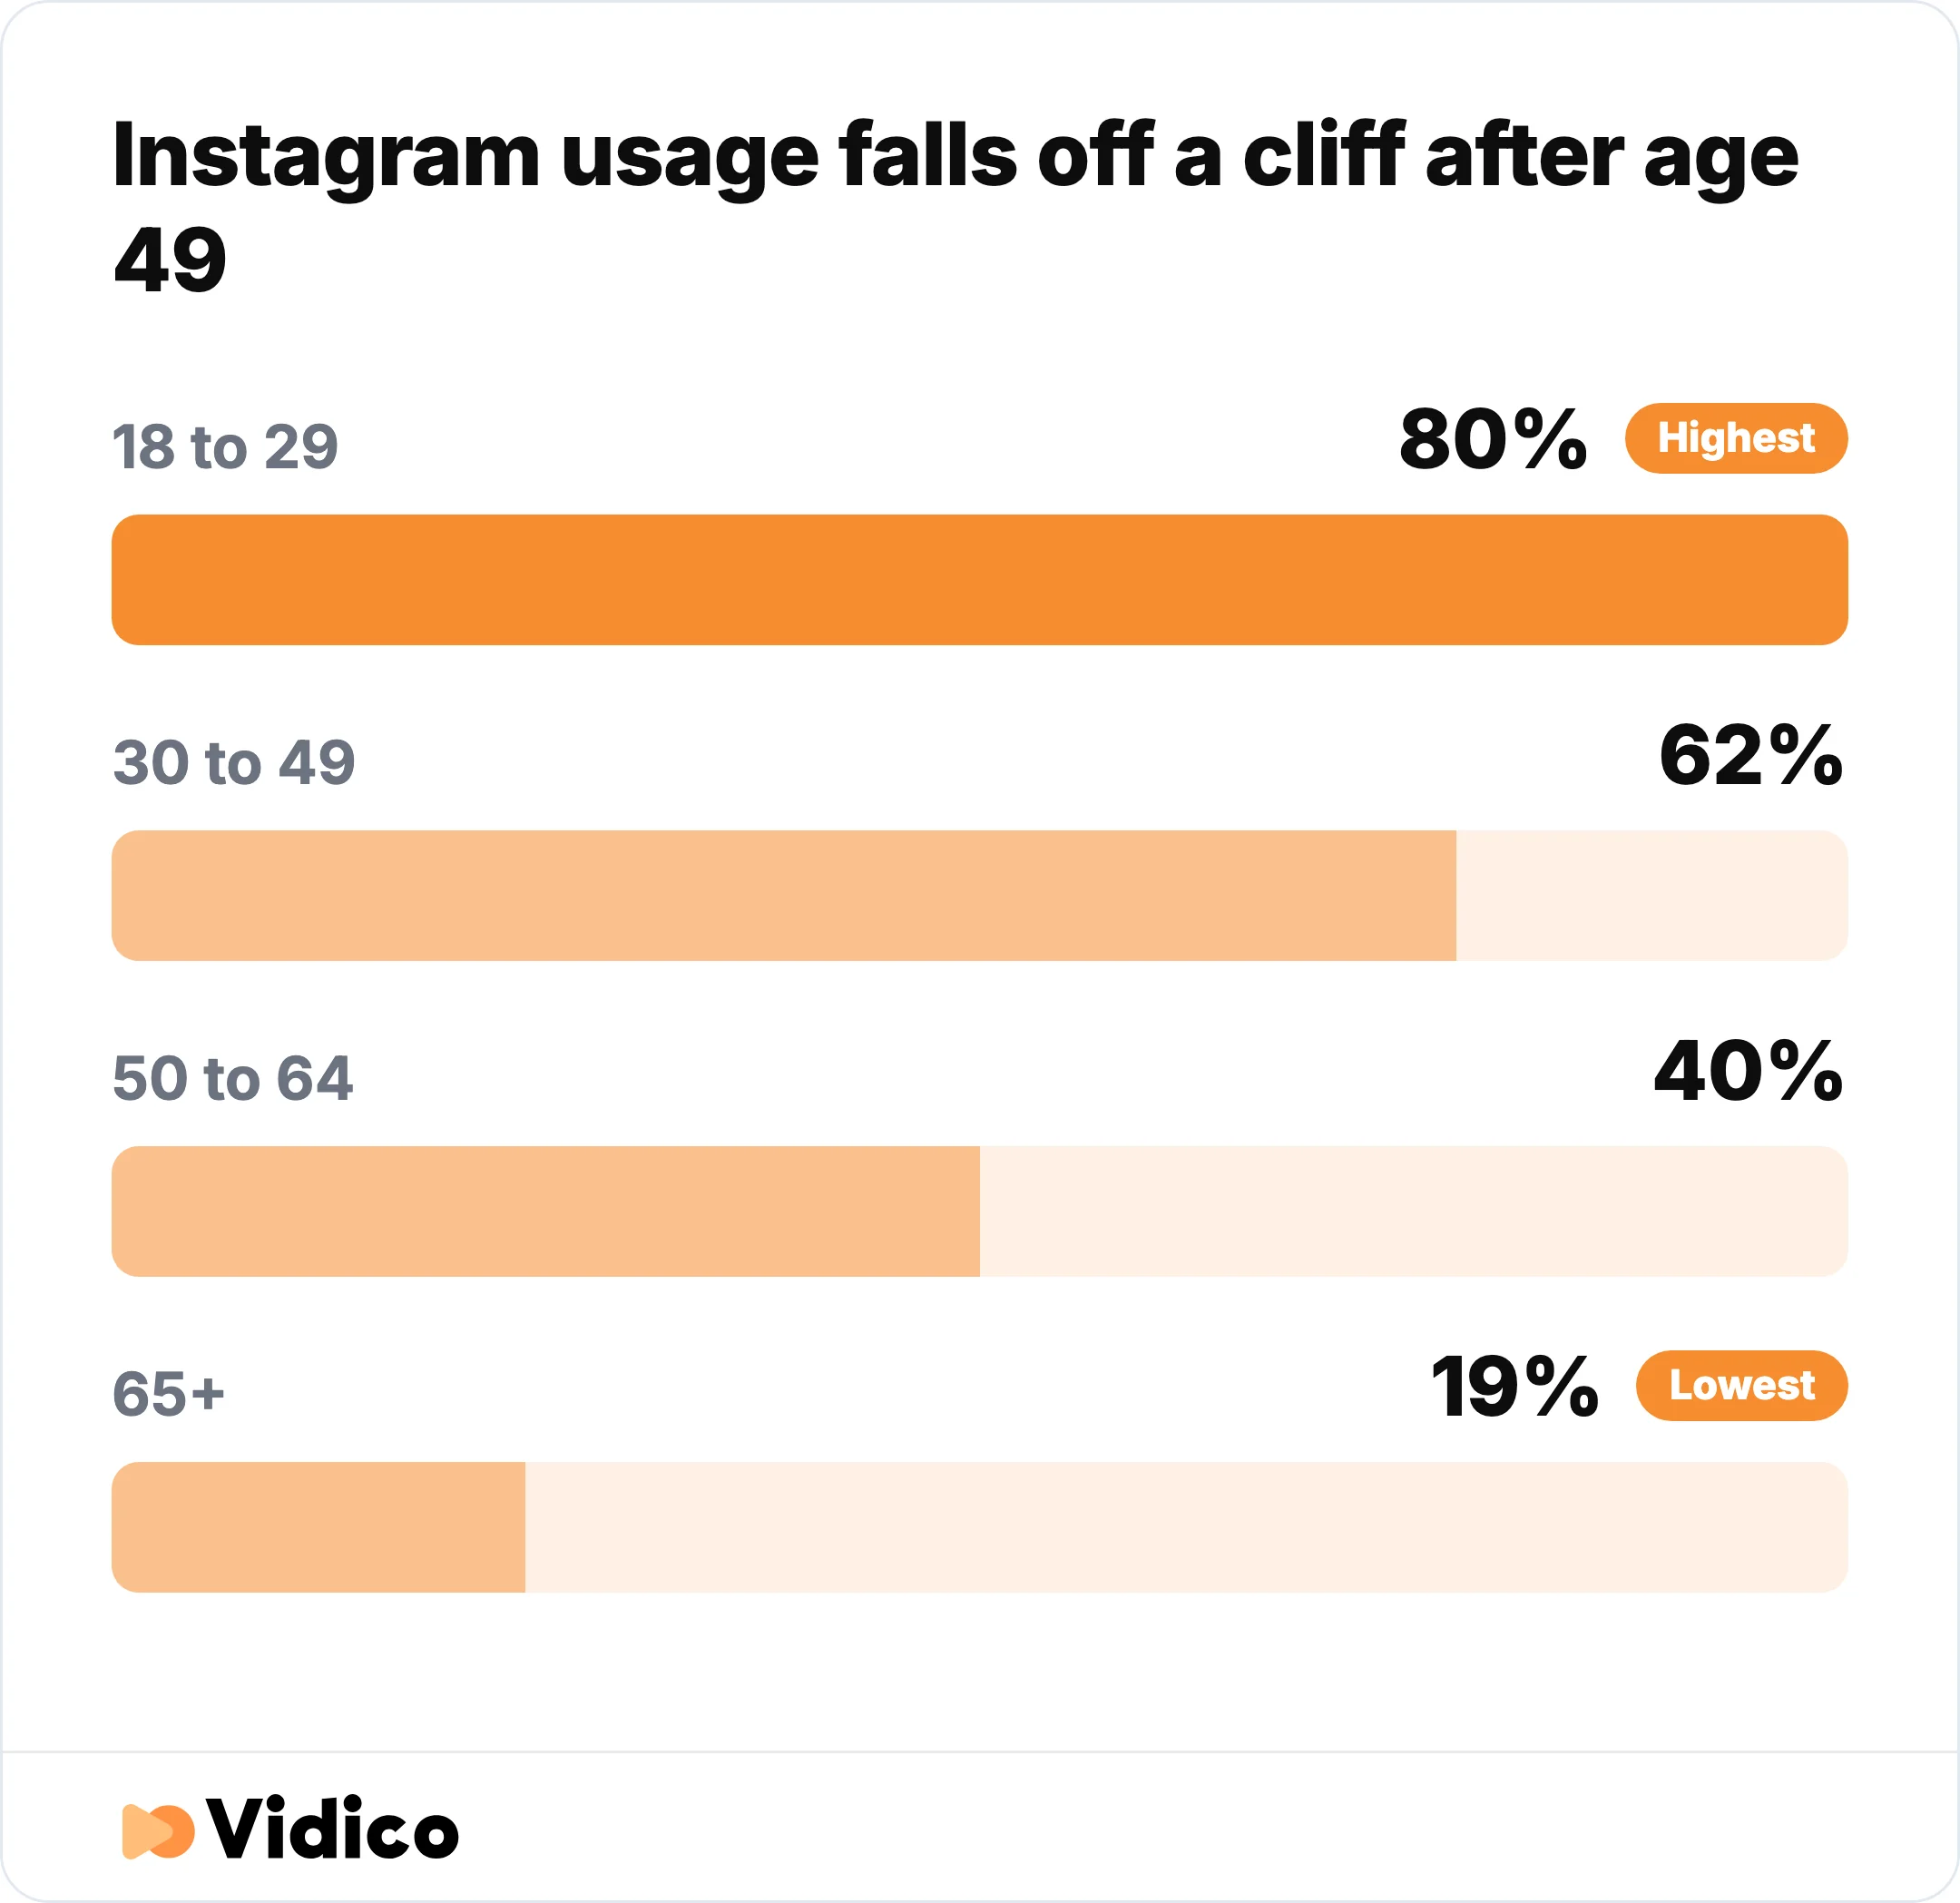
Instagram usage drops sharply with age, which shapes who Reels actually reach. Source: Pew Research Center.
-
India has the most Instagram users at 414 million, followed by the US at 172 million and Brazil at 141 million. DataReportal ranks the largest national audiences from Meta’s ad-reach data.
-
North America accounts for 192 million of Instagram’s reachable ad audience. DataReportal’s regional breakdown shows how much of Instagram’s audience sits outside its largest markets in Asia and Latin America.
-
Meta reported $51.24 billion in Q3 2025 revenue, up 26% year over year. The result, reported by Tubefilter, was driven in large part by Reels ad demand.
-
Meta’s full-year 2025 revenue reached $201 billion, up 22%. Meta’s Q4 and full-year results show short-form video as a central growth driver.
Instagram Reels vs other video formats
Reels, Stories, TikTok, and YouTube Shorts each serve a different job. Reels are built for discovery beyond your followers, Stories are short-lived and follower-focused, TikTok leans on virality, and Shorts ride YouTube’s search and subscriber base. Here is how the four formats compare across lifespan, primary strength, and best use.
| Format | Lifespan | Primary strength | Best used for |
|---|---|---|---|
| Instagram Reels | Permanent (on profile) | Non-follower discovery via Explore and feed | Reaching new audiences at scale |
| Instagram Stories | 24 hours | Follower engagement, quick updates | Nurturing existing followers |
| TikTok | Permanent | Virality and trend velocity | Testing creative and cultural moments |
| YouTube Shorts | Permanent | Search and subscriber crossover | Long-tail discovery and evergreen clips |
Instagram phased out IGTV because long-form standalone video did not fit how people used the app. Reels absorbed that demand by keeping video short, vertical, and recommendation-driven.
How to check your own Instagram Reels stats
Instagram provides per-Reel analytics through Instagram Insights on Business and Creator accounts. Open a Reel, tap View Insights, or use the Insights dashboard for account-wide trends. The metrics that matter most are:
- Views: how many times your Reel started or replayed.
- Watch time: the total time people spent watching, the top ranking signal.
- Accounts reached: the unique accounts that saw the Reel, split by followers and non-followers.
- Retention and skip rate: where viewers drop off, especially in the first three seconds.
- Interactions: likes, comments, shares, and saves, with sends (DM shares) worth watching closely.
Instagram’s own help documentation lists the full metric set and how each is measured.
What the numbers mean for B2B and SaaS brands
Reels are not only a B2C play. Tech and SaaS teams use them for brand awareness, product education, and lead generation, and the data points to a clear approach.
Three patterns stand out. First, chase completion, not reach: with reach declining across formats, watch time and sends drive distribution more than impressions do. Second, track your account size: for larger accounts, carousels can out-reach Reels, so test formats rather than assuming Reels always win. Third, post consistently, since same-day content now earns a real recommendation edge.
Formats that consistently perform for B2B brands include short product explainers that simplify a feature in seconds, motion graphics that make data digestible, and user-generated-style content that shows real use. Teams like Slack, Canva, HubSpot, and Notion use Reels for product demos, tutorials, and behind-the-scenes culture.
This lines up with our own research. In Vidico’s 2026 State of Creative report, a survey of more than 230 B2B tech marketers, customer-proof video and paid-social video were named the highest-impact formats for the year. We put that into practice for ecommerce brand Koala, where a long-form ad campaign with social cutdowns delivered a 20% lift in positive response rate and a Platinum MUSE Award.
If you want an outside read on your creative before you invest, our Creative Intelligence Report is a free competitive analysis across 12 areas, delivered in 48 hours. Spots are limited.
Related reading
FAQs
How does Instagram’s algorithm rank Reels?
Instagram ranks Reels mainly on watch time, likes per reach, and sends per reach, per Adam Mosseri. It favors content that holds attention and gets shared, then pushes high-performing Reels to non-followers through Explore and the main feed.
What is a good engagement rate for Instagram Reels?
A typical Reel engagement rate sits between about 0.5% and 1.2% depending on the study and account size, per Socialinsider and Metricool. Industry matters too: Dash Social found rates range from 0.1% to 0.5% across sectors, so compare against your own vertical.
How many Reels are played each day?
More than 200 billion Reels are played every day across Instagram and Facebook, based on Meta’s most recent official figure. Reels also make up 46% of US time spent on Instagram.
What is the ideal length for an Instagram Reel?
Instagram allows Reels up to 3 minutes, but the algorithm still favors clips under 90 seconds for non-follower reach. Shorter Reels tend to hold attention and complete better, which feeds the watch-time signal.
Are Instagram Reels effective for business marketing?
Yes. Reels reach beyond your existing followers, carry the platform’s highest ad demand, and drive strong engagement for brands that lead with a clear hook and a shareable payoff. Both B2C and B2B teams use them to build awareness and generate leads.
How do I see the stats for my own Reels?
Open a Reel on a Business or Creator account and tap View Insights, or use the Insights dashboard for account-wide data. You will see views, watch time, accounts reached, retention, and interactions, including saves and sends.
Conclusion
The Instagram Reels statistics for 2026 tell one story: short-form video is where the reach, the attention, and the ad money now sit. Reels drive nearly half of US time on Instagram, carry a $50 billion ad run rate, and get a distribution boost when you post fresh and often. The brands that win treat Reels as a discovery engine and optimize for watch time and shares, not raw impressions.
Vidico builds short-form and social video systems for SaaS and tech brands, turning one shoot into more than 40 platform-ready assets so lean teams can keep posting without burning out. If you are planning your Reels strategy, book a free strategy session or take our pricing quiz to scope a project.
Sources
- CNBC: Instagram now has 3 billion monthly active users
- CNBC: Most of Instagram’s Ads Ran on Reels
- Tubefilter: Meta Reels surpass 200 billion daily views
- Tubefilter: Meta Reels $50 billion annual run rate
- DataReportal: Essential Instagram Stats
- Socialinsider: Instagram Engagement Benchmarks
- Metricool: Instagram Study
- Dash Social: Instagram Reels Performance Benchmarks
- eMarketer: Instagram Powered by Reels Ascends the Paid Social Throne
- Social Media Today: Instagram Expands Reels Length to 3 Minutes
- Hootsuite: Instagram Algorithm Guide
- Meta: Q1 Earnings Call Transcript
- Hootsuite: Instagram Statistics
- Pew Research Center: Social Media Fact Sheet
- Statista: Average Reach per Instagram Post
- Instagram Help Center: View Insights on Your Reels
- Meta: Fourth Quarter and Full Year Results