
Mobile carries about 78% of ecommerce traffic but only 56.4% of US online spend, and roughly 51.51% of global web page views as of June 2026. There are 5.8 billion unique mobile subscribers worldwide, close to 70% of the planet. Americans exchanged nearly 2.2 trillion text messages in 2024. Every figure on this page names its source, its date, and what it actually measures.
We rebuilt this page in July 2026. Every statistic was traced back to the organisation that originally published it, and any number we could not trace was removed rather than repeated. Fourteen widely-quoted mobile stats did not survive that check, and we list them near the end so you can stop citing them too.
Key Takeaways
- Mobile owns the traffic, desktop still owns the close. Mobile drives about 78% of ecommerce traffic and 66% of orders, but only 56.4% of US online spend. Those are three different numbers and most articles collapse them into one.
- The “mobile is 70% of web traffic” claim is wrong. StatCounter measured 51.51% in June 2026. The higher 62.54% figure still in circulation is the same StatCounter data licensed by Statista, frozen at its Q4 2024 value. No panel supports 70%.
- SMS open rate cannot be measured. Text messaging has no tracking pixel, so the 98% open rate quoted everywhere is a delivery rate. Click rate and revenue per message are the metrics platforms actually publish.
- Loading speed is the one thing most mobile sites still fail. 62% of mobile sites pass Google’s loading benchmark, against 77% for responsiveness and 81% for visual stability.
- Nobody publishes global mobile ad spend anymore. The IAB dropped its mobile breakout after 2022 and no forecaster replaced it. Every “$430 billion” figure online traces back to pages that cite nothing.
Content
How to Read These Numbers
Mobile marketing statistics are unusually unreliable as a category. The same figures circulate for years, get rounded, get reattributed, and eventually appear with a current year attached to data collected a decade ago.
Three rules govern every number below.
Each stat names its publisher and its date. Where a figure comes from a forecast rather than a measurement, we say so. Where the underlying data is old but still the best available, we give the collection year, not the republication year.
Scope is stated explicitly. Global and US figures are not interchangeable. Neither are “per mobile user” and “per adult”, or traffic share and revenue share. Most disagreements between mobile statistics are scope differences, not contradictions.
Vendor benchmarks are labelled as vendor benchmarks. Data from platforms like Klaviyo, Contentsquare or Sensor Tower reflects that platform’s customer base, not the whole market. It is still the best measured data available for several of these questions, so we use it and tell you whose book it comes from.
A small number of figures come from research that sits behind a paywall, mainly eMarketer. Those are named in the text but carry no link, because we will not link you to something you cannot read. Everything in the Sources list at the bottom is publicly accessible.
Mobile Usage and Adoption Statistics
1. There are 5.8 billion unique mobile subscribers worldwide, around 70% of the global population. GSMA’s Mobile Economy report, published February 2026, counts unique people rather than SIM cards.
2. The world’s mobile subscribers hold 8.8 billion wireless connections between them. Connections outnumber people because of second devices, tablets and machine-to-machine SIMs, per GSMA. This gap is why “mobile penetration” figures vary so widely depending on which denominator a source picks.
3. About 6 billion people used the internet at the end of 2025, roughly three-quarters of the world. The ITU’s Facts and Figures, published November 2025, put growth at 240 million people over the year, with 2.2 billion still offline.
4. 58% of the global population, about 4.7 billion people, reach the internet through a mobile device they own. GSMA reports a further 9%, around 710 million people, used mobile internet on a device belonging to someone else. The underlying adoption data is year-end 2024.
5. 96% of the world lives in an area served by a mobile broadband network. GSMA notes just under 40% of the global population, more than 3 billion people, remain unconnected despite coverage, making affordability and literacy the binding constraint rather than infrastructure.
6. 91% of US adults own a smartphone and 98% own a mobile phone of some kind. Pew Research Center’s mobile fact sheet is based on 5,022 US adults surveyed between February and June 2025 using address-based sampling.
7. 16% of US adults are smartphone-dependent, meaning they have no home broadband and rely on a phone for internet access. Pew found this rises to 34% in households earning under $30,000 and falls to 4% in households above $100,000. For anyone arguing a mobile-first case internally, this is a stronger number than any traffic share, because it describes people with no desktop fallback at all.
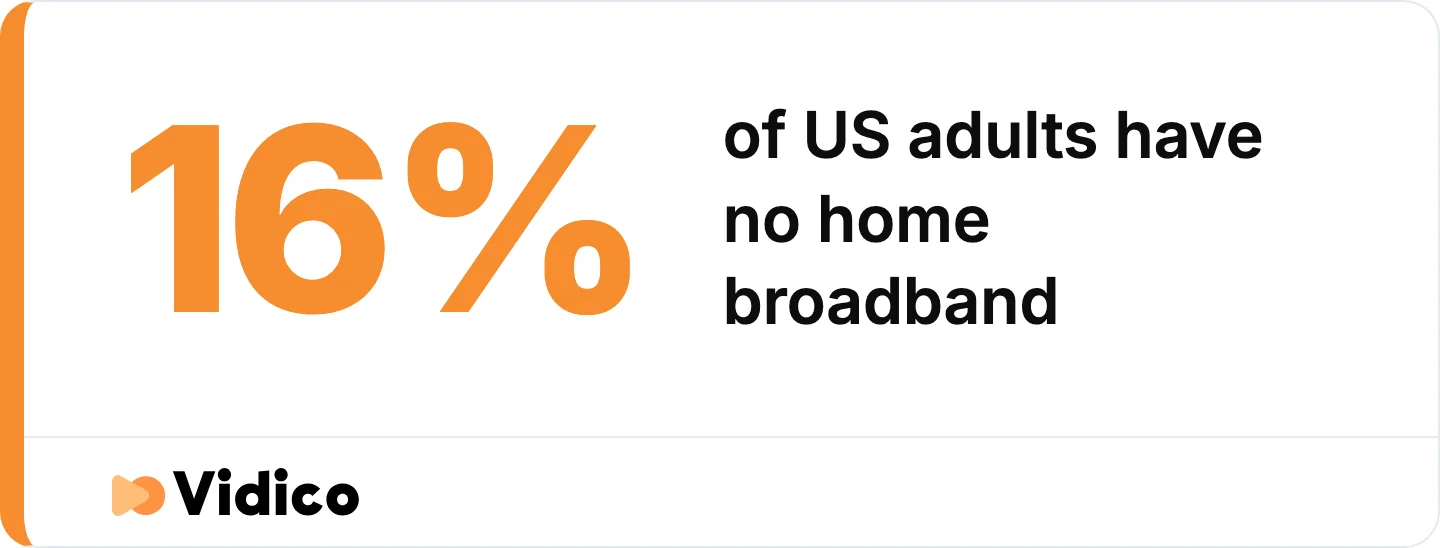
Smartphone dependence rises to 34% in households earning under $30,000 and falls to 4% above $100,000. Source: Pew Research Center mobile fact sheet.
8. 91% of Americans aged 12 and over own a smartphone, an estimated 262 million people. Edison Research’s Infinite Dial surveyed 2,050 people aged 12 and up in January 2026, weighted to the national population.
9. Americans check their phones an average of 186 times a day. Reviews.org runs this study annually with roughly 1,000 US adults, census-weighted, with a stated margin of error of 4%. It is self-reported rather than measured on-device, and the year-on-year swing has exceeded that margin, so treat it as a directional attitude measure.
10. US adults spend more than 8 hours 30 minutes a day with digital media, and mobile is just under half of it. eMarketer’s July 2025 estimate puts daily digital media time at 8 hours 36 minutes. Mobile’s share slipped below 50% for the first time in a decade in 2024, at 49.3%, as connected TV absorbed more of the day.
11. Mobile app users worldwide averaged 3.6 hours a day in apps during 2025. Sensor Tower’s State of Mobile measured 5.3 trillion total hours across iOS and Android during the year.
12. 39% of Americans aged 12 and over own a smart speaker, an estimated 112 million people, up from 35% a year earlier. Edison Research measures device ownership here, which is not the same as voice search usage. No credible source publishes voice search share, so we make no claim about it.
Want the creative benchmarks behind these behaviours? Our State of Creative in Tech report surveys 230+ B2B tech marketing leaders on budgets, formats and production speed.
Mobile Web Traffic Statistics
13. Mobile accounted for 51.51% of global web page views in June 2026, against 47.12% for desktop and 1.36% for tablets. StatCounter analyses user agents across more than a million member websites and 3 to 5 billion page views a month. The data is unweighted and measures page views, not people.
14. The widely-quoted 62.54% mobile traffic figure is not a second opinion, it is the same data two years out of date. Statista licenses this series from StatCounter rather than measuring it independently, and 62.54% was its Q4 2024 value. The current figure in that series is 52.27% for Q1 2026. Two sources that look like corroboration are often one source quoted at two different times.
15. Mobile generates 69.9% of sessions on the sites Contentsquare measures. Its Digital Experience Benchmark covers 99 billion sessions across more than 6,500 websites between Q4 2024 and Q4 2025. The figure runs higher than StatCounter’s because the sample skews to consumer retail and travel brands, where mobile use is heaviest.
16. There are 99 mobile broadband subscriptions for every 100 people on earth. ITU subscription data shows mobile broadband is now 89% of all mobile subscriptions, up from under half in 2015, and 36% of mobile broadband subscriptions run on 5G. Subscriptions overcount individuals, so this is not a penetration rate.
17. There were 3.1 billion 5G subscriptions worldwide as of Q1 2026. The Ericsson Mobility Report recorded 162 million added in that quarter alone and forecasts 6.4 billion by 2031.
18. 5G is roughly 35% of the world’s mobile connections, not 45%. Ericsson’s 3.1 billion 5G subscriptions divided by GSMA’s 8.8 billion total connections gives about 35%, and Ericsson separately described 5G as one-third of all mobile subscriptions at the end of 2025. The widely-quoted 45% appears to conflate 5G’s share of data traffic with its share of subscriptions.
19. In the US specifically, 45% of wireless connections run on active 5G devices. CTIA’s annual survey counted 259 million active 5G devices against 579 million total US wireless connections, or about 1.7 connections per person. US 5G adoption genuinely does sit near 45%, which is likely where the global claim came from.
Mobile Commerce Statistics
20. Mobile drives 78% of global ecommerce traffic and 66% of orders. Salesforce’s Shopping Index recorded both figures growing 4% year on year in Q1 2026. The 12-point drop between traffic share and order share is the most important number in mobile commerce, and almost no article reports the two side by side.
21. In the US, mobile takes 75% of ecommerce traffic but 64% of orders. Salesforce recorded US mobile traffic share up 4% and order share up 5% year on year. The US runs a few points behind the global average on both measures.
22. Asia-Pacific and the Middle East and Africa are the most mobile-first regions on earth. Salesforce put mobile traffic share at 85% in both regions, with orders at 75% in APAC and 73% in MEA. Emerging markets skipped the desktop era, so mobile-first is closer to mobile-only there.
23. Mobile drove 56.4% of US online spend over the 2025 holiday season, up from 54.5% a year earlier. Adobe Analytics measured $257.8 billion in total US online spend between November 1 and December 31, up 6.8%. Spend share sits below order share because desktop baskets are larger.
24. Mobile’s share of sales peaked at 66.5% on Christmas Day. Adobe recorded Thanksgiving Day next at 61.6%. Mobile share rises on days people are away from a desk, which is a scheduling insight as much as a channel one.
25. Only 38.8% of returns happen on mobile, against 56.4% of spend. Adobe’s split shows people buy on a phone and then move to a desktop to unwind the purchase. Post-purchase mobile experience is measurably weaker than the buying experience, and almost nobody reports this gap.
26. Desktop average order value is $255 against $164 on mobile. Dynamic Yield’s ecommerce benchmarks, covering 400+ brands and 300 million sessions, show the desktop basket running roughly 55% larger, retrieved July 2026. This is a live series that drifts month to month.
27. 67.4% of the US population are mobile commerce buyers, roughly 225 million people. This eMarketer estimate dates from July 2024 and is the most recent publicly retrievable figure we found.
28. Forecasts saying mobile will “cross 50% of US ecommerce in 2027” have already been overtaken by measurement. eMarketer’s December 2025 update projected that crossover, but Adobe measured mobile at 56.4% of US online spend during the 2025 holiday season. When a forecast and a measurement disagree, use the measurement.
29. Traffic share, order share and spend share are three different metrics. Mobile leads on all three but by shrinking margins: 78% of global traffic, 66% of orders, 56.4% of US holiday spend. Any strategy built on the traffic number alone overstates how much revenue mobile actually closes.
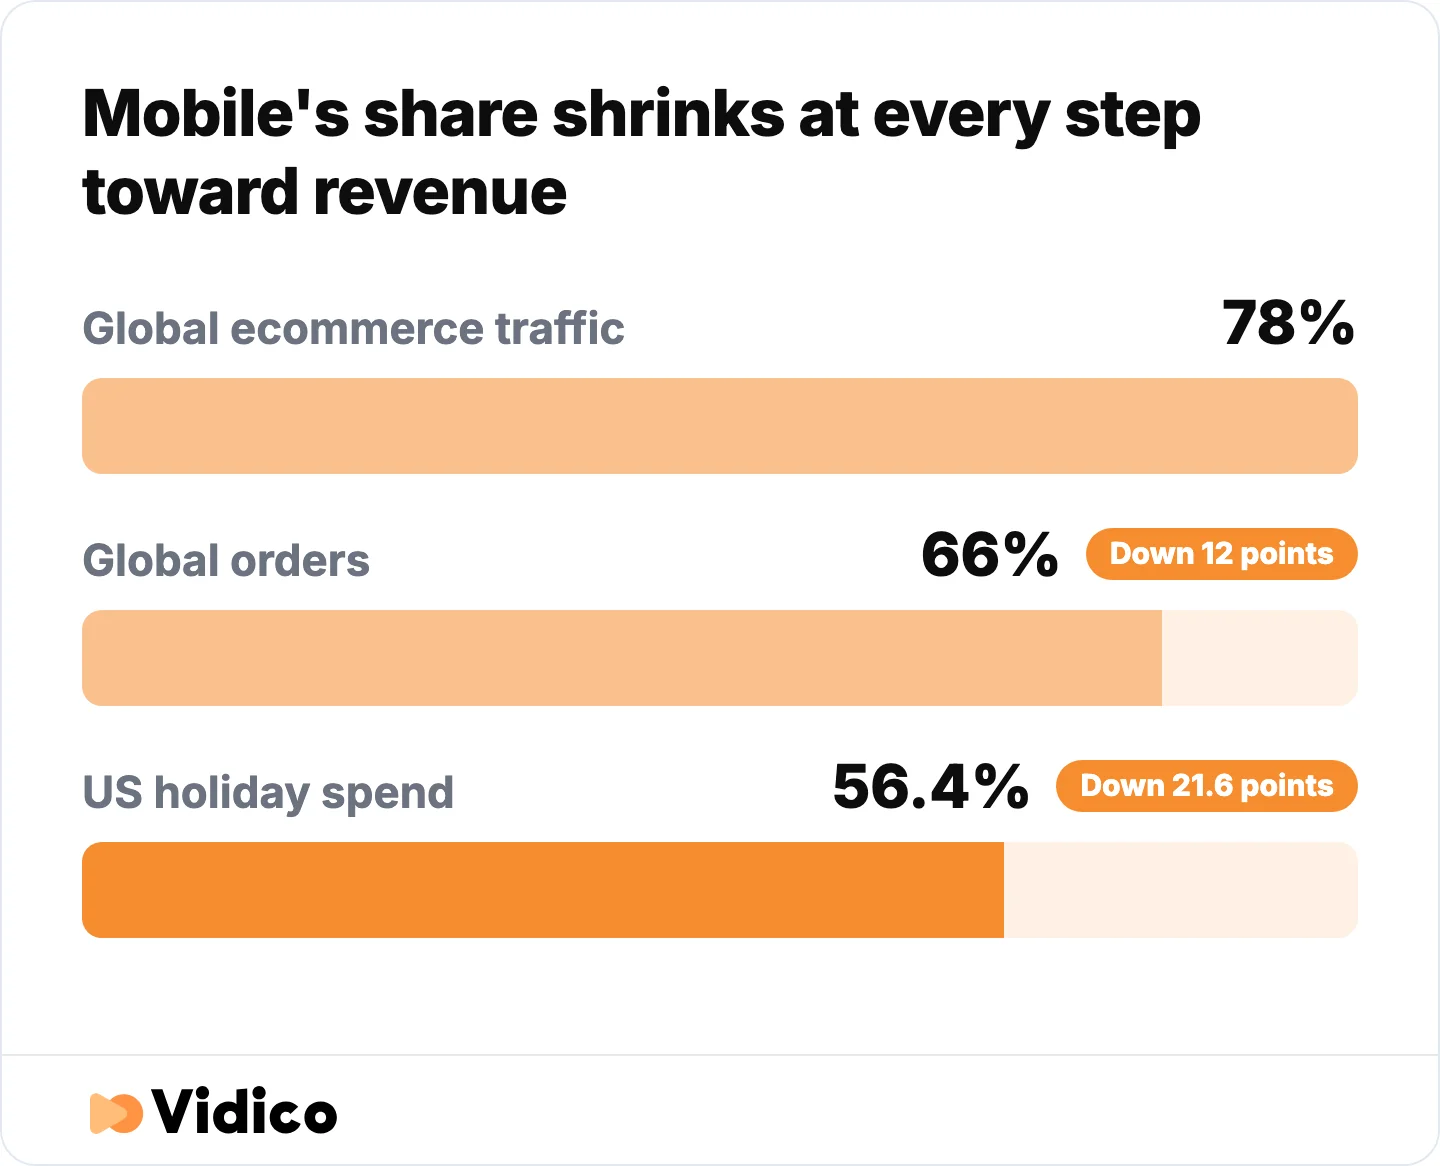
Mobile leads on all three measures but by shrinking margins, so strategy built on the traffic number alone overstates revenue. Sources: Salesforce Shopping Index (Q1 2026) and Adobe Analytics (2025 holiday season).
Mobile Conversion and Experience Statistics
30. Desktop converts 74% higher than mobile across all industries. Contentsquare’s benchmark, drawn from 99 billion sessions, is the largest measured conversion gap published. Its client base skews to large enterprise brands, so read it as the enterprise picture rather than a universal rate.
31. Retail sites convert at 3.7% on desktop against 2.0% on mobile. Contentsquare’s retail benchmark also recorded both falling year on year, desktop by 8% and mobile by 3.5%.
32. Mobile cart abandonment runs at 79.92% against 69.19% on desktop. Dynamic Yield’s abandonment benchmark covers more than 200 million monthly unique users, retrieved July 2026. Tablets sit between the two at 72.31%.
33. The most-cited device abandonment split, 80.02% mobile versus 66.41% desktop attributed to Baymard Institute, does not exist. Baymard’s cart abandonment meta-analysis contains no device breakout at all. The real device split is Dynamic Yield’s, and the near-identical 79.92% strongly suggests where the fabricated figure came from.
34. 48% of mobile websites have good Core Web Vitals, up from 44% a year earlier. The HTTP Archive Web Almanac uses real Chrome user data across millions of origins. Desktop sits higher at 56%.
35. Loading speed is the one benchmark most mobile sites still fail. On mobile, 62% of sites pass the loading threshold, 77% pass responsiveness and 81% pass visual stability, per HTTP Archive. Load time is the bottleneck, not interactivity or layout shift.
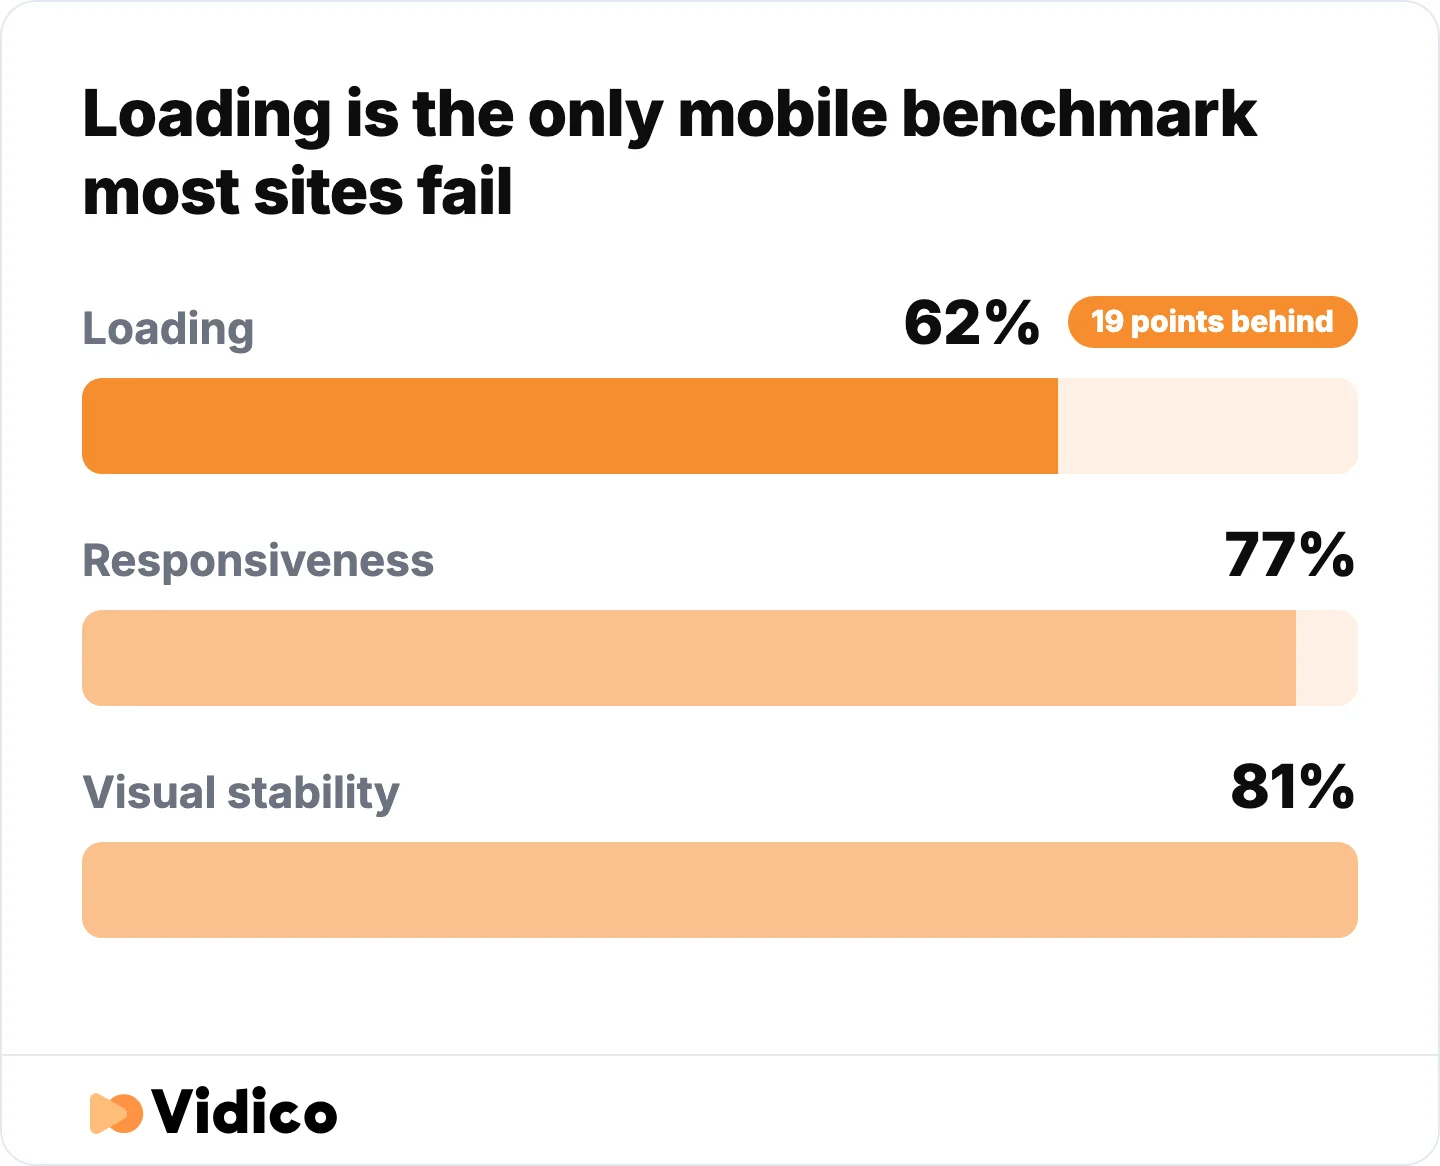
Load time is the bottleneck on mobile, not interactivity or layout shift. Source: HTTP Archive Web Almanac.
36. Sites in the fastest speed band saw retail conversions run 8.4% higher and travel conversions 10.1% higher. Deloitte and Fifty-Five, commissioned by Google, audited 37 brand sites across more than 30 million mobile sessions, comparing a 0.1-second difference across four combined speed metrics. The study observed naturally occurring variation rather than running a controlled test, so read it as correlation. Fieldwork ran in late 2019 and nothing comparable has been published since.
37. Bounce probability rises 123% as mobile load time goes from one second to ten. This comes from Google and SOASTA research conducted in 2017, modelled with a stated 90% prediction accuracy.
38. The famous “53% of mobile users abandon a site that takes over 3 seconds” stat is from 2016 and says something slightly different. Google’s DoubleClick report measured 53% of visits, not users, from 3,700 sites that opted into sharing analytics benchmark data, collected March 2016. Sessions and people are different units, the sample was self-selected, and the study has never been re-run.
Planning mobile creative around these numbers? Our free video marketing plan helps you map formats and channels against what you are actually trying to move.
Mobile Advertising Statistics
39. US internet advertising revenue reached $294.6 billion in 2025, up 13.9% year on year. The IAB and PwC Internet Advertising Revenue Report, published April 2026, surveys companies selling US internet advertising and reports actual revenue rather than estimates.
40. No organisation publishes a global mobile advertising figure anymore. The IAB dropped its mobile breakout after its 2022 report, IAB Europe’s benchmarks do not use the word “mobile” at all, and MAGNA and WPP Media split by channel and country rather than device. Every “$430 billion global mobile ad spend” figure online traces to pages that cite no source.
41. The last published US mobile ad revenue figure was $154.1 billion, or 73.5% of all US internet ad revenue. That comes from IAB and PwC’s 2022 report and is the most recent real measurement of mobile’s share. It is more than three years old, and we include it because no replacement exists, not because it is current.
42. Global advertising spend is forecast to reach $1.06 trillion in 2026, with digital at 69% of the total. Dentsu’s global forecast, published May 2026, covers 56 markets. This is a projection made within the year it projects.
43. WARC sized the global ad market at $1.19 trillion for 2025 and forecast 9.1% growth for 2026. The two forecasters differ by roughly $130 billion, which is a useful reminder of how wide the error bars are on any single ad spend number.
44. Mobile marketing software is a separate market from mobile media spend, and the two get confused constantly. Market-size forecasts in the $18 billion to $80 billion range describe spend on the tooling, not on the advertising. We are not quoting a specific projection here because the widely-circulated base year, end year and growth rate for this market are not arithmetically consistent with each other.
45. Video ads reached 79.7% viewability globally in 2025 against 67.9% for display, an 11.8 point advantage. Integral Ad Science’s Media Quality Report, published July 2026 from more than 300 billion daily digital interactions, covers open web desktop and mobile web but excludes in-app and social.
46. Mobile web display is 45.1% of open web impressions but 71.9% of made-for-advertising impressions. IAS also attributes 54.9% of brand suitability failures and 71.5% of ad clutter impressions to mobile web. Mobile web display viewability sits at 64.5% against 71.6% on desktop, which IAS attributes to higher ad density and faster scroll rates compressing time in view.
SMS Marketing Statistics
47. Americans exchanged nearly 2.2 trillion SMS and MMS messages in 2024, up 42 billion year on year. CTIA’s figure is a census of US wireless carriers rather than a sample, making it the most reliable number on this page. Volume is the highest since 2020.
48. 89% of US consumers have signed up to receive texts from at least one business, up from 66% in 2021. EZ Texting’s consumer texting report surveyed 959 US mobile phone owners in January 2026.
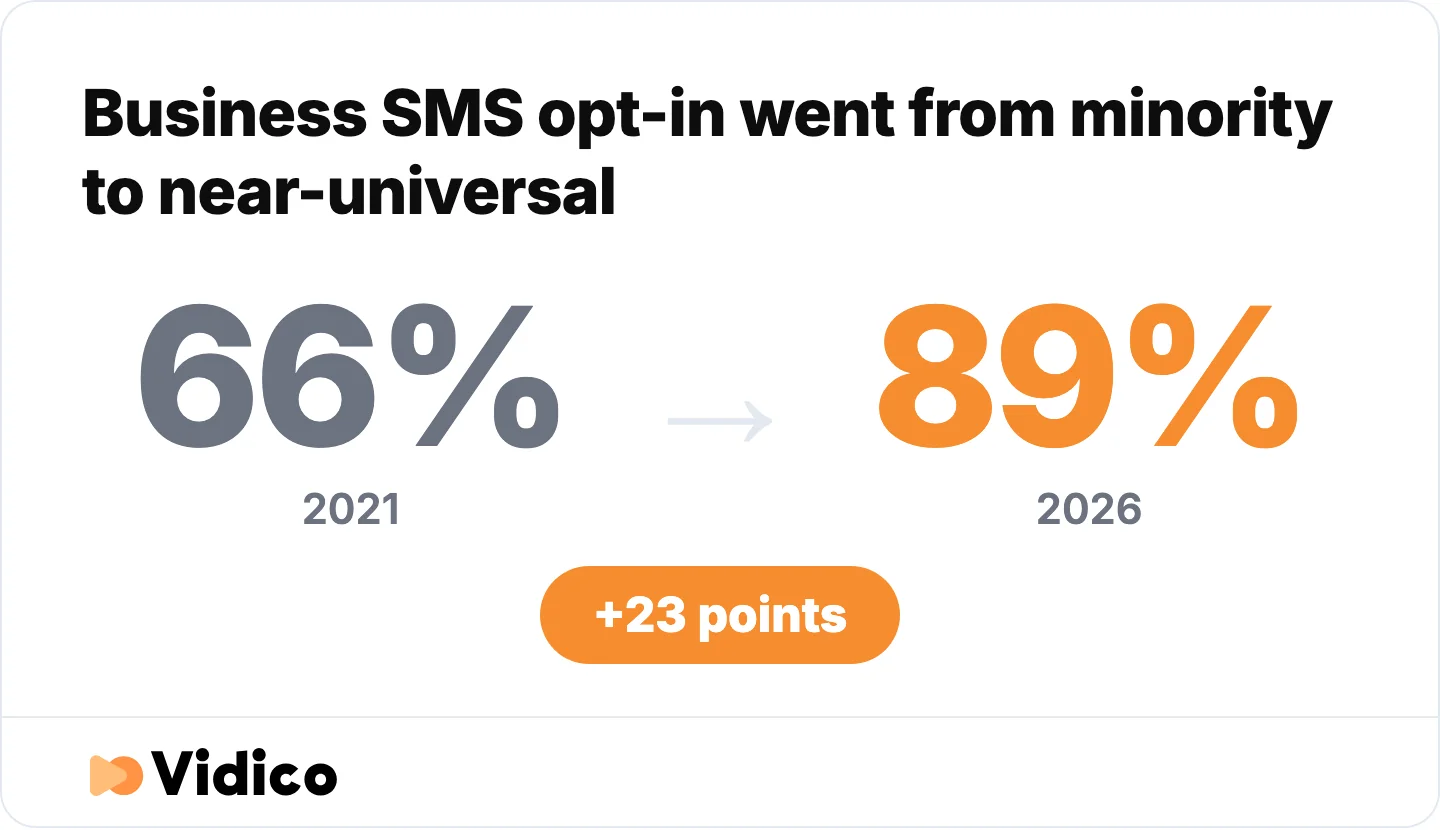
Nine in ten US consumers now accept texts from at least one business, a 23-point rise in five years. Source: EZ Texting consumer texting behavior report, 959 US mobile phone owners surveyed January 2026.
49. A separate survey put business SMS opt-in at 86%. SimpleTexting surveyed 1,000 US consumers in January 2026. Two independent surveys landing within three points of each other is unusually strong corroboration for a consumer marketing statistic.
50. 87% of consumers check new texts within 15 minutes, and 32% check immediately. EZ Texting’s read-latency data is the best-sourced replacement for the vague “texts are read in 3 minutes” claim that circulates without attribution.
51. 67% say they are more likely to buy from a business whose texts they subscribe to, and 70% expect a reply within an hour. EZ Texting also found message frequency is the top reason people opt out, cited by 40%.
52. The 98% SMS open rate quoted across the industry cannot be measured and has no original study behind it. SMS has no tracking pixel. Carriers return delivery receipts, not open events, and preview text is readable on a lock screen without the thread ever being opened. What vendors label an open rate is a delivery rate. Klaviyo’s own published SMS benchmarks include click rate, conversion rate, unsubscribe rate and revenue per recipient, and no open rate at all.
53. Klaviyo rates an SMS campaign click rate above 14.6% as great and below 5.9% as critical. Its published benchmarks, aggregated across US customers and updated October 2025, put conversion above 2.1% and revenue per recipient above $2.42 in the top band.
54. Median revenue per SMS sent is $0.98, rising to $2.13 at the 75th percentile and $4.54 at the 90th. Postscript measured more than 17,000 Shopify stores between January and mid-December 2025. Median subscriber retention after 30 days was 93.1%.
55. Automated SMS flows are 7.6% of messages sent but drive 45.2% of SMS revenue. Klaviyo’s benchmark across more than 183,000 customers puts revenue per recipient from flows at roughly eight times campaign sends.
56. Message copy alone shifts SMS conversion by up to 19%. Attentive analysed 25 billion sends across 13 industries using propensity score matching to control for more than 50 confounding factors. The weakest elements cut conversion by 24%. These are relative lifts, not absolute conversion rates.
Mobile Video Statistics
57. YouTube Shorts averages 200 billion daily views. YouTube’s CEO published the figure in January 2026. It is platform-reported and unaudited.
58. The typical online adult spends 18 hours 36 minutes a week scrolling social and video feeds, about 16% of waking hours. DataReportal’s global digital report, using GWI survey data, found women aged 16 to 24 average 25 hours 45 minutes, close to 22% of waking life.
59. Video engagement falls from 52% at under a minute to 17% past an hour, while click-through moves the opposite way. Wistia’s State of Video, covering 13 million videos and 79 million hours of viewing, recorded click-through rising from 1% on sub-minute videos to 23% on 30 to 60 minute videos. Short video wins attention. Long video wins action. Most mobile strategies optimise for the first and then wonder why the second never happens. Our short-form video statistics page breaks down the shorter end of that curve.
60. Vertical HD uploads grew 24% year on year. Wistia recorded 4K up 16%, 720p down 8% and square down 4%, measured across its own platform, which skews B2B. Vertical is now the default for TikTok and Instagram Reels distribution.
61. Standard pre-roll completion rates run 74% on desktop, 69% on mobile and 94% on connected TV. Innovid measured this across more than 200 billion served video ad impressions. The data is from 2019 and remains the most recent device-level completion benchmark any ad server has published openly, which is itself worth knowing.
62. Adding a vertical asset to a landscape-only YouTube campaign lifts viewability on Shorts by more than 45% and average watch time by 20%. Google’s advertiser documentation cites its own global 2024 internal data. This measures adding vertical to a mix, not vertical beating horizontal head to head, and no platform publishes a controlled comparison of the two.
63. US digital video ad spend is forecast to pass $80 billion in 2026, with social video growing 13% against connected TV’s 11%. The IAB’s video ad spend report, published May 2026, marks the first year social video growth outpaces CTV, attributing the shift to AI-powered personalisation and creator-economy spend. Digital video is expected to exceed 60% of total TV and video ad spend for the first time.
64. Television overtook mobile as the primary YouTube viewing device in the US. YouTube’s CEO published this in February 2025, with more than a billion hours a day watched on TV screens. Nielsen’s ratings put YouTube at 13.4% of all US TV watch time as of April 2026. Mobile-first does not mean mobile-only, and for video the centre of gravity has moved back to the living room.
65. 20% of US adults regularly get news on TikTok, up from 3% in 2020, rising to 43% of under-30s. Pew Research surveyed 5,153 US adults in August 2025.
Mobile App Statistics
App marketers can pair these figures with our app promo video examples.
66. Global app downloads reached nearly 150 billion across iOS and Google Play in 2025, up just 0.8%. Sensor Tower’s estimate makes flat growth the story here, not expansion.
67. Consumers spent $167 billion inside apps in 2025, up 10.6%. Sensor Tower measures gross revenue including the app store cut, and excludes commerce transacted through apps like Amazon or Uber.
68. Non-game apps out-earned games for the first time in 2025. Non-gaming in-app purchase revenue grew 21% while gaming grew 1.3% to around $82 billion, per Sensor Tower. Subscription apps, not games, are now the centre of app monetisation.
We deliberately publish no cost-per-install or app retention benchmarks. Every source for those figures is gated, and every freely available number we checked traced back to sites that cite nothing.
Mobile Search Statistics
69. Google has never published a numeric mobile versus desktop split of its search queries. In May 2015 it said only that more Google searches take place on mobile devices than on computers in 10 countries including the US and Japan, naming just two of the ten and citing unpublished internal data. It repeated the point without numbers in November 2016. Any article quoting a precise percentage of Google searches happening on mobile is quoting something nobody published. StatCounter’s 51.51% page view share is the closest defensible proxy, and it measures traffic, not searches.
70. Google holds 89.2% of general search queries, rising to 94.9% on mobile and falling to 84% on desktop. These findings come from the US District Court opinion in United States v. Google, drawn from sworn expert testimony and Google’s internal exhibits. The figures describe 2020. This is Google’s share of mobile search, not mobile’s share of search.
71. 80% of Gen Z online shoppers use Google for shopping, including discovery, research and purchase. Think with Google cites Google and Ipsos research across 18 markets with 5,405 Gen Z online shoppers, fielded March 2024. It is a useful corrective to the claim that younger buyers have abandoned search.
72. 76% of people who run a local search on a phone visit a business within a day. This figure comes from a Google diary study of 1,000 smartphone users fielded in May 2016. It is quoted constantly without its date. Ten years on it is still the original source, and 30% of mobile searches were location-related at the time.
What B2B Tech Marketers Say About Mobile-First Creative
Mobile marketing data is overwhelmingly consumer and ecommerce data. Almost nothing published addresses B2B teams, so we ran our own research. For the broader picture, see our video marketing statistics page.
Our State of Creative in Tech report surveyed more than 230 B2B tech marketing leaders. These are industry findings about how those teams operate, not results from our own client work.
73. 76% of B2B tech marketers say their creative production budget is increasing this year. Media spend rising on mobile channels only matters if the creative to fill those channels gets funded too, and it is.
74. Paid social video and customer-proof video tie as the highest-impact formats for 2026. Paid social is overwhelmingly a mobile surface, which makes this the most directly mobile-relevant finding in the study.
75. Mid-form video is now the leading content format, by a narrow margin. This sits against the assumption that mobile means short-form only, and it matches Wistia’s finding that longer videos drive higher click-through.
76. Most teams take 4 to 14 days to go from concept to live, while teams with reusable creative systems ship in 1 to 3 days. Mobile channels consume creative faster than any other, and only 1 in 3 teams has a fully reusable asset system.
77. 65% run structured creative experimentation at least monthly. Mobile’s conversion gap is partly a creative testing problem, and two-thirds of teams are now testing on a regular cycle.
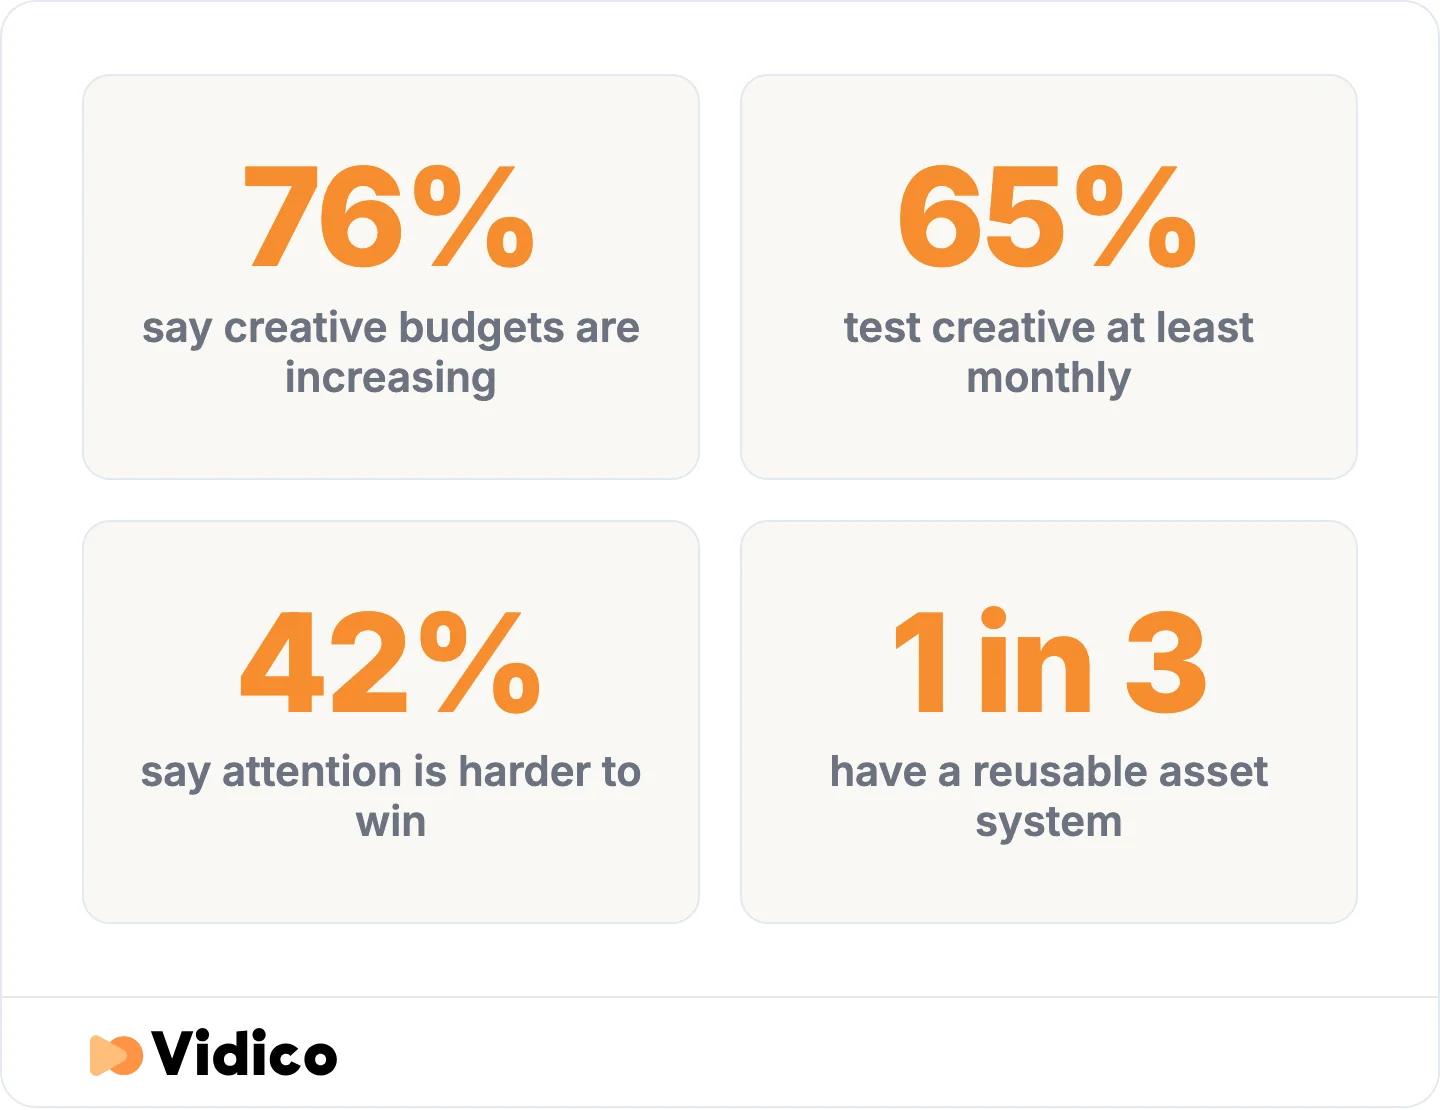
Budgets and testing cycles are rising while attention gets harder to win, and only a third of teams have a reusable asset system. Source: State of Creative in Tech, 230+ B2B tech marketing leaders.
78. 42% say getting attention is harder than it was, and 35% cite accelerating creative fatigue. This is the practical explanation for why mobile ad costs climb while performance flattens. The channel is not degrading. The creative is wearing out faster than teams can replace it.
Building a repeatable mobile creative process? Our on-demand masterclass on scaling B2B creative covers how teams move from one-off campaigns to systems.
That preference shows up directly in the kind of B2B video production work brands are commissioning for mobile-first campaigns.
Mobile Marketing Statistics You Should Stop Citing
We checked every statistic on the previous version of this page against its original source. Fourteen did not survive. They appear across most of the pages ranking for this topic, so they are worth naming.
“90% of YouTube views happen on mobile.” The opposite is now true in the US. YouTube’s CEO confirmed in February 2025 that television has overtaken mobile as the primary viewing device by watch time.
“72% of global internet traffic is mobile.” No measurement panel supports this. StatCounter measured 51.51% in June 2026. The 62.54% often cited alongside it is the same StatCounter series licensed by Statista, frozen at its Q4 2024 value.
“72.9% of online sales come from mobile.” This was a Statista projection made for the end of 2021 and was never an observed figure.
“42% of mobile purchases are influenced by social media.” Widely attributed to Mintel, whose published research contains no such figure. Adobe’s measured transaction data puts social at 4.6% of online revenue. The number traces back to an uncited listicle, and the original wording was “made directly through” social platforms, not “influenced by” them.
“40% of mobile purchases are impulse buys.” The original claim was that mobile users are 40% more likely than desktop users to buy on impulse. A relative comparison was rewritten as an absolute share. The two statements are unrelated.
“66% of email is opened on mobile.” Traces to a Movable Ink report from 2014. Apple’s Mail Privacy Protection has since broken device attribution entirely, which is why Litmus stopped publishing device splits. No current figure exists.
“47% of people prefer to check email on mobile.” Traces to a 2017 report from a small Australian email provider.
“52% of PPC clicks come from mobile.” No source exists. WordStream and LocaliQ’s search advertising benchmarks, covering roughly 13,000 campaigns across 23 industries, publish no device split at all. Neither does Google.
“98.5% of Facebook users access it on mobile.” Traces to a Statista series whose last data point was January 2022 and which has since been discontinued. Meta publishes no device split.
“63% of Google searches happen on mobile.” Google has published no device split for search since 2015.
“80% of Gen Z, 62% of millennials, 66% of Gen X and 35% of Boomers use mobile search.” The first three appear on a HubSpot blog post with no sample size, field date or underlying survey. The 35% Boomer figure traces to no source at all, and the general population figure on HubSpot’s own page is 54%, not the 52% usually quoted alongside it. Not one of the five is traceable to real fieldwork.
“1.7 billion mobile AR users.” A 2020 ARtillery Intelligence forecast of 1.73 billion for 2024. Actual 2024 came in near 1.03 billion, about 40% below the projection.
“187.5 million US mobile buyers.” An eMarketer forecast made in 2020 for 2024, during the pandemic ecommerce surge, and repeated as current fact ever since.
“Mobile cart abandonment is 80.02% versus 66.41% on desktop, per Baymard.” Not on Baymard’s page. Their meta-analysis has no device breakout.
The pattern is consistent. A vendor press release or a single forecast becomes a listicle citation, the qualifier gets dropped, the number gets rounded, and five years later it is quoted with a current year attached. Checking one link upstream catches almost all of it.
FAQs
How effective is mobile marketing?
Mobile marketing reaches people where they spend most of their screen time, but effectiveness varies sharply by channel. SMS is the strongest measured performer, with median revenue of $0.98 per message sent across 17,000 Shopify stores. Mobile web is the weakest converter, running 74% below desktop on Contentsquare’s benchmark. The gap between those two is why “is mobile marketing effective” has no single answer.
How big is the mobile marketing market?
Mobile advertising spend is no longer separately reported by anyone. The IAB dropped its mobile breakout after 2022, when US mobile ad revenue was last measured at $154.1 billion, and no forecaster publishes a global mobile figure today.
Why does mobile get more traffic but less revenue?
Mobile drives about 78% of ecommerce traffic and 66% of orders, but only 56.4% of US online spend, because desktop baskets are larger. Desktop average order value is $255 against $164 on mobile. Mobile also abandons carts more often, at 79.92% against 69.19%. Discovery happens on the phone. Larger considered purchases still tend to complete elsewhere.
What is a good SMS marketing click rate?
Klaviyo classifies an SMS campaign click rate above 14.6% as great, 8.9% to 14.5% as good, and below 5.9% as critical, based on aggregated US customer data. Automated flows outperform broadcast campaigns substantially, generating 45.2% of SMS revenue from 7.6% of sends. Ignore any open rate benchmark, because SMS has no mechanism to measure opens.
How fast does a mobile site need to load?
62% of mobile sites currently pass Google’s loading benchmark, the lowest pass rate of the three Core Web Vitals. Deloitte’s audit of 37 brand sites found a 0.1-second improvement lifted retail conversions 8.4%. The often-quoted three-second threshold comes from a Google study conducted in March 2016 that measured abandoned visits rather than users, and it has never been repeated.
Does mobile matter for B2B marketing?
Mobile matters for B2B reach and discovery more than for conversion. Paid social video, an overwhelmingly mobile format, ties with customer-proof video as the highest-impact format for 2026 among the 230+ B2B tech marketing leaders in our State of Creative research. Nearly all published mobile commerce and conversion data is consumer retail, so B2B teams should treat those benchmarks as directional rather than as targets. Our B2B video marketing statistics page covers the B2B side in more depth.
Conclusion
Mobile is where discovery happens and where attention lives, but it is not where every sale closes. The honest version of the mobile story is a set of gaps: 78% of ecommerce traffic against 56.4% of spend, a 74% desktop conversion advantage, and a loading benchmark most mobile sites still fail. Those gaps are the opportunity, and they are invisible if you only quote the traffic number.
The bigger problem with this category is that most of its published data does not survive a source check. Fourteen of the statistics previously on this page traced back to forecasts that missed, vendor press releases from 2016, or figures that no named organisation ever published. We removed them rather than refresh the year on them.
At Vidico, we produce B2B explainer and social video for SaaS and tech marketing teams, including mobile-first work like Wisr’s app campaign, which contributed to more than 10,000 app downloads. Mobile channels consume creative faster than any other channel, which is why we build reusable template systems for each brand rather than one-off projects.
If you want to see where your mobile creative sits against competitors in your category, our Creative Intelligence Report covers 12 areas and comes back within 48 hours. If you would rather talk it through, book a strategy session.
Sources
- GSMA: The Mobile Economy
- ITU: Facts and Figures
- Pew Research Center: Mobile Fact Sheet
- Edison Research: The Infinite Dial
- Reviews.org: Cell Phone Usage Study
- Sensor Tower: State of Mobile
- StatCounter: Platform Market Share
- Contentsquare: Digital Experience Benchmark
- Salesforce: Shopping Index
- Ericsson: Mobility Report
- CTIA: Annual Survey Highlights
- Adobe: Analytics Holiday Shopping Recap
- Dynamic Yield: Average Order Value Benchmark
- Dynamic Yield: Cart Abandonment Benchmark
- HTTP Archive: Web Almanac Performance
- IAB and PwC: Internet Advertising Revenue Report
- dentsu: Global Ad Spend Forecasts
- WARC: Global Ad Forecasts
- Integral Ad Science: Media Quality Report
- EZ Texting: Consumer Texting Behavior Report
- SimpleTexting: SMS Marketing Statistics
- Klaviyo: Campaign SMS and MMS Benchmarks
- Postscript: SMS Marketing Benchmarks
- Attentive: High-Performing SMS Campaign Insights
- YouTube Official Blog: The Future of YouTube
- YouTube Official Blog: Our Big Bets
- DataReportal: Digital Global Overview Report
- Wistia: State of Video Report
- Innovid and IAB: Global Video Benchmarks Report
- Google Ads Help: Video Reach Campaigns
- IAB: US Digital Video Ad Spend
- Nielsen: The Gauge
- Pew Research Center: News on TikTok
- US District Court: United States v. Google Memorandum Opinion
- Think with Google: Search Innovations
- Google: How Mobile Search Connects Consumers to Stores
- Litmus: Email Client Market Share
- Baymard Institute: Cart Abandonment Rate Statistics
- ITU: Subscriptions Data
- Contentsquare: Retail Digital Experience Benchmark
- Deloitte and Google: Milliseconds Make Millions
- Google DoubleClick: The Need for Mobile Speed
- Google Ads Blog: Building for the Next Moment