![70+ Video Marketing Statistics Every Marketer Needs in 2026 [Updated Data]](https://vidico.com/app/uploads/2026/06/video-marketing-statistics-featured-featured.webp)

Global spending on digital video advertising has surpassed $214 billion, and 91% of businesses now use video as a marketing tool. These are the video marketing statistics that define the market in 2026, pulled from primary research and industry reports so you can build a strategy backed by current data.
At Vidico, we have produced over 2,000 B2B explainer video campaigns for brands including Square, Spotify, and Airtable. We track these numbers because they shape the creative production decisions we make with clients every month.
Key Takeaways
- Video adoption is at a ceiling. 91% of businesses use video and 93% consider it important to their marketing strategy. Growth now comes from doing it better, not doing it at all.
- ROI expectations are rising. 82% of marketers report good ROI from video, down from 93% the year prior. The bar for what counts as “good” is higher.
- AI tools are reshaping production. 63% of video marketers now use AI tools for video creation or editing, up from 51% last year. But only 29% of B2B tech teams have a formal AI governance policy.
- LinkedIn is the new B2B video channel. 81% of B2B teams share video on LinkedIn, making it the top distribution platform for B2B, overtaking YouTube for the first time.
- Short-form dominates preference. 78% of consumers prefer learning about a product through a short video, compared to just 9% who prefer reading a text article.
Video Marketing Adoption and Usage
Video marketing adoption has hit its ceiling. The question for marketing teams in 2026 is not whether to use video but how to produce enough of it at the quality the market demands.
1. 91% of businesses use video as a marketing tool. Video marketing adoption has returned to its all-time high after dipping to 85% in 2022. According to the State of Video Marketing report, this number has been above 85% for six consecutive years.
2. 93% of video marketers consider video an important part of their strategy. According to the State of Video Marketing report, this figure has remained near-record levels for three years running, confirming that video is no longer experimental for most marketing teams.
3. 67% of marketers who do not use video plan to start in 2026. The State of Video Marketing report shows this number holding steady year-over-year, indicating a persistent pipeline of new entrants and growing competition for attention.
4. Small business adoption trails the overall rate. Smaller teams use video less than the market as a whole, partly due to budget and bandwidth constraints. Falling production costs and subscription-based models are closing this gap.
5. 59% of businesses create video content in-house. The majority now produce internally, while 32% use a hybrid of in-house and external production. Only 10% rely exclusively on outside vendors, according to the State of Video Marketing report.
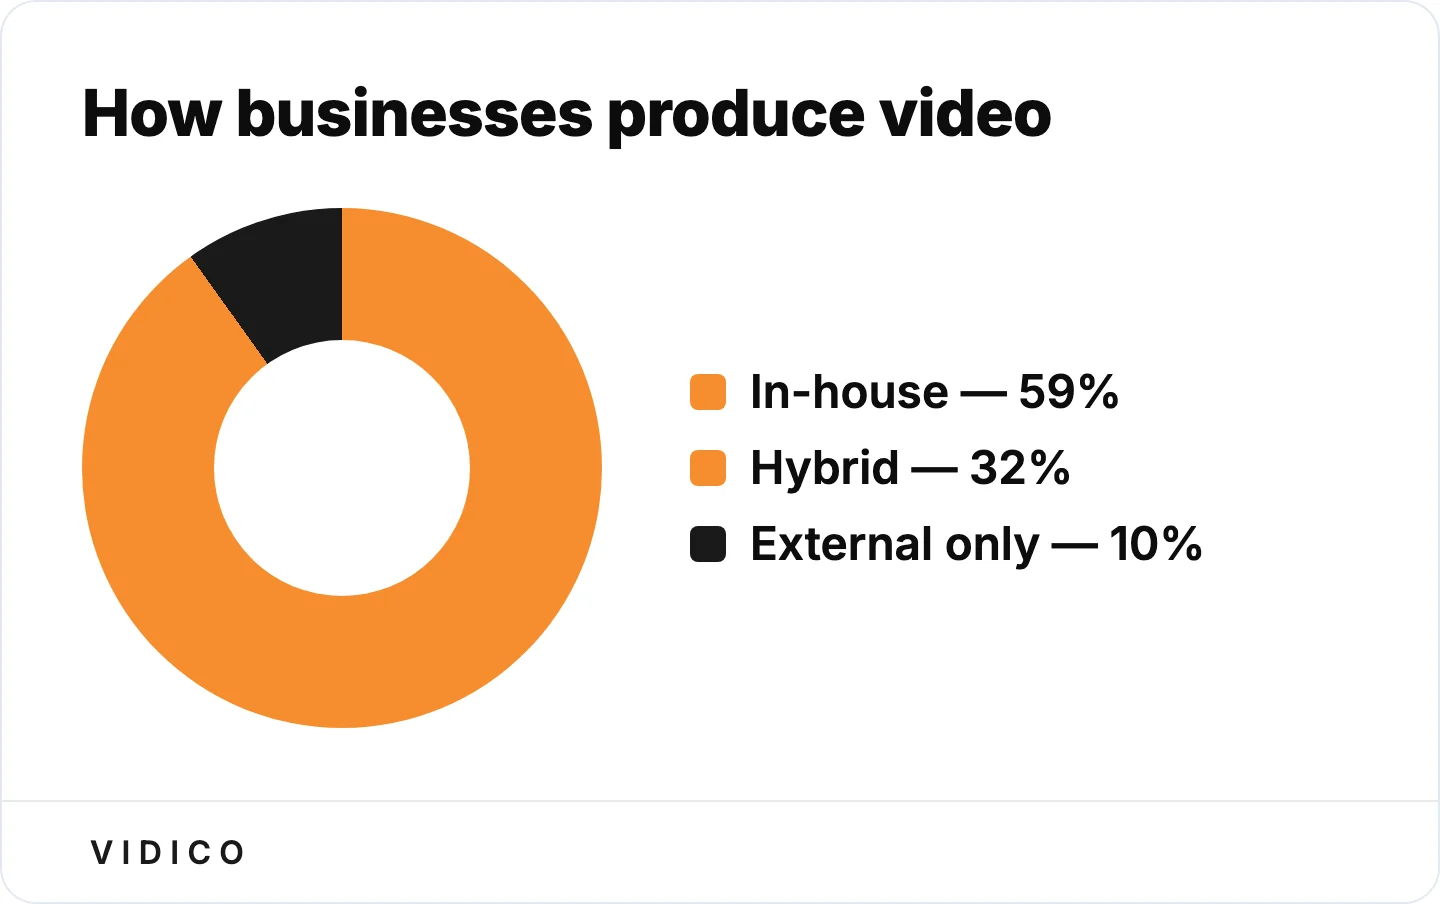
Most teams now produce video internally, with hybrid models filling the gap. Source: State of Video Marketing report.
6. 76% of video teams produce at least one video per month. Regular production cadence is now the norm, not the exception. Teams with reusable template systems report hitting weekly or even daily output, according to Wistia’s State of Video Report.
7. 88% of marketers say video improves user understanding of their product. Per the State of Video Marketing report, video helps buyers grasp complex products faster than text or static images, which matters most for SaaS and tech products with multi-feature platforms.
8. Videos uploaded to business platforms grew 15% year-over-year. According to Wistia’s State of Video Report, total watch time on business video platforms surged 44% in the same period. More than half of digital video viewers now spend over 100 minutes daily watching online video content.
Consumer Behavior and Video Preferences
Consumers prefer video over every other content format for learning about products. The data below tracks how viewers engage with, retain, and act on video content in 2026.
9. 78% of consumers prefer to learn about a product via short video. Only 9% prefer reading a text article, according to the State of Video Marketing report. This gap has widened every year since 2020.
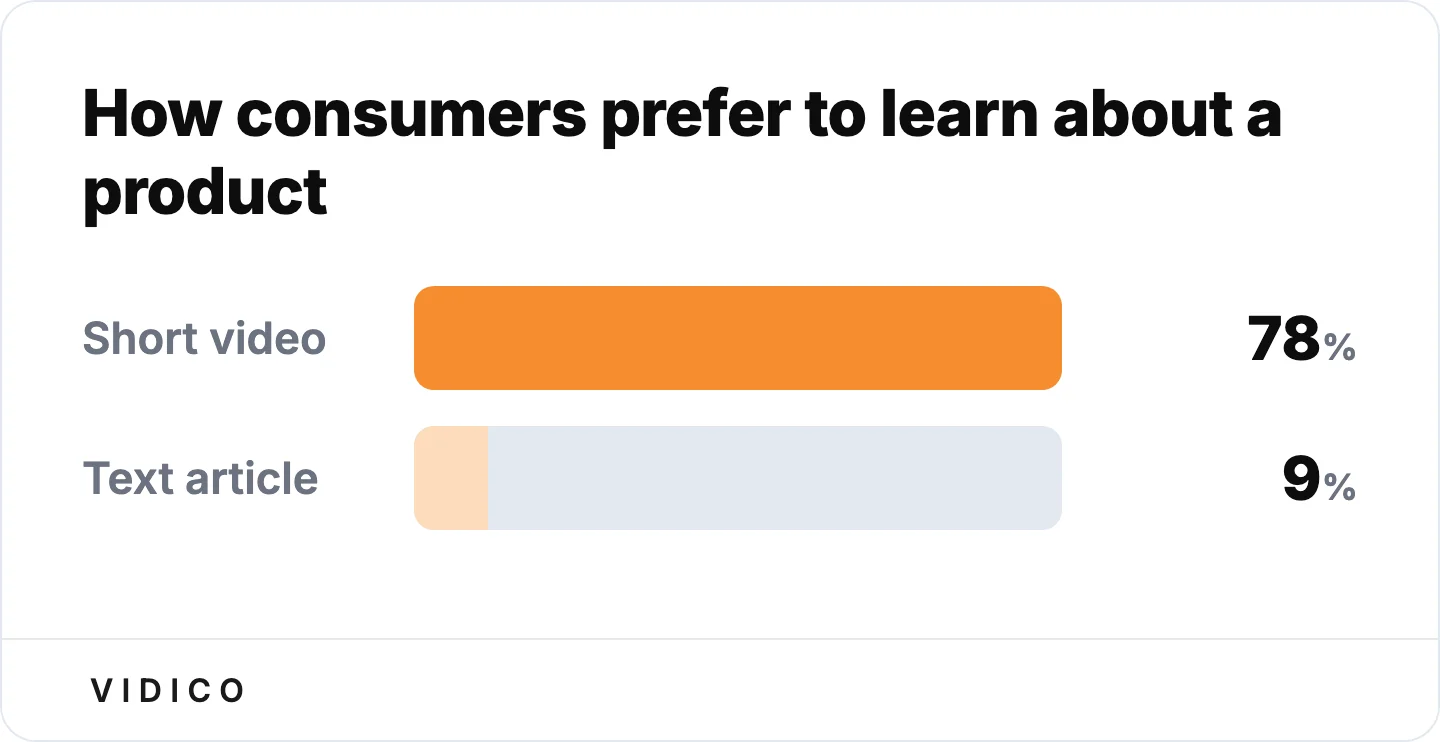
Consumers overwhelmingly pick short video over reading to learn about a product. Source: State of Video Marketing report.
10. Video drives higher message retention than text. Viewers remember more of what they watch than what they read, which is why marketers lean on video to land complex points. Exact retention multipliers vary by study and should be treated as directional, not precise.
11. 96% of consumers have watched an explainer video to learn about a product or service. Explainer videos remain the highest-reach format in marketing. Nearly every consumer has encountered one, making quality and differentiation the real competitive factors.
12. 85% of consumers say a video has convinced them to buy a product or service. According to the State of Video Marketing report, this figure has held above 80% for four consecutive years, confirming video’s sustained influence on purchase decisions.
13. 87% of consumers say video quality impacts their trust in a brand. According to the State of Video Marketing report, low production quality does not just look bad. It actively damages brand perception. Brands investing in professional production see measurably higher trust signals from audiences.
14. 89% of consumers want to see more video content from brands. Consumer demand for brand video continues to outstrip supply, according to the State of Video Marketing report. This gap between demand and output is a consistent finding across years.
15. Video earns far more social shares than text and image posts. Its shareability makes video one of the most effective formats for organic amplification, and the platform data below shows the gap by channel. One well-distributed video can reach audiences that text content never touches.
16. Placing a video on a landing page can increase conversions by up to 80%. Wistia’s State of Video Report found that video on homepages gets the highest play rates, and longer-form videos (30 to 60 minutes) drive the highest conversion rates at 17%.
17. 77% of consumers want interactive video content. According to Idomoo’s State of Video Technology report, demand for interactive features rises to 93% among Gen Z viewers. Interactive video moves viewers from passive watching to active engagement.
18. 74% of consumers want personalized video from brands. Personalized video sees higher completion rates and engagement than generic content, per Idomoo’s research. For more data, see our personalized video statistics breakdown.
Video Marketing ROI and Business Impact
Video continues to drive measurable business results, though marketers now expect more than vague “ROI” claims. The data below tracks lead generation, sales, traffic, and retention outcomes in 2026.
19. 82% of video marketers say video provides a good ROI. This figure dropped from 93% the year prior, according to the State of Video Marketing report. The decline does not mean video is less effective. It signals that a broader pool of marketers are holding video to higher attribution standards.
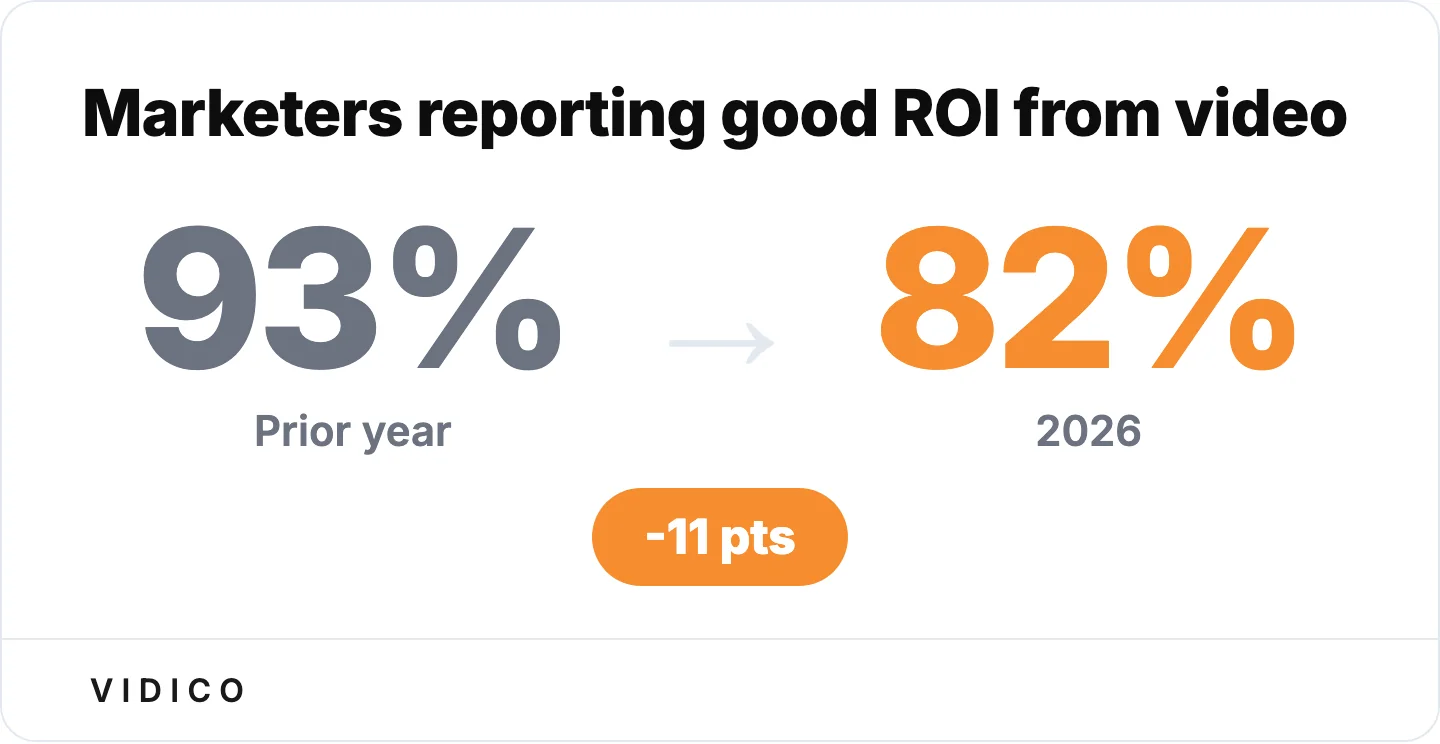
Fewer marketers rate video ROI as good, reflecting higher attribution standards, not weaker results. Source: State of Video Marketing report.
20. 90% of marketers say video increases brand awareness. According to the State of Video Marketing report, brand awareness remains the top-cited benefit of video marketing. Video combines visual and auditory processing, making messages more memorable than text or static images alone.
21. 86% of marketers report increased web traffic from video. According to the State of Video Marketing report, video content keeps visitors on site longer and encourages deeper browsing. Pages with embedded video consistently outperform text-only pages on engagement metrics.
22. 85% of marketers say video has directly helped generate leads. Lead generation is now the second most-cited benefit of video marketing, up from fourth position three years ago. According to Wistia’s data, lead generation forms embedded in video outperform traditional CTAs and annotation links.
23. 83% of video marketers say video has directly increased sales. The State of Video Marketing report puts video among the highest-impact content types for driving revenue, not just awareness. Sales teams increasingly use video in outbound sequences and deal-closing workflows.
24. 82% of marketers say video increases visitors’ time on site. This benefit is tracked in the State of Video Marketing report. Longer dwell time correlates with improved brand recall, higher trust, and increased likelihood of conversion, making video a reliable lever for extending session duration.
25. 57% of marketers say video has reduced support queries. According to the State of Video Marketing report, instructional and FAQ videos handle repetitive customer questions at scale, freeing support teams for complex issues. This is one of video marketing’s most underappreciated ROI drivers.
26. 42% of marketers use video to enhance customer retention and engagement. Per the State of Video Marketing report, post-purchase video content (onboarding, product updates, case studies) strengthens existing customer relationships and reduces churn.
27. 67% of video marketers quantify ROI through video views. According to the State of Video Marketing report, views remain the most common measurement metric, followed by engagement metrics like shares and likes (63%) and lead attribution through clicks (28%). The gap between view tracking and revenue attribution is a persistent challenge.
28. Customer outcomes and results are the most persuasive proof type, at 42.7%. In Vidico’s 2026 State of Creative in Tech report, surveying 230+ B2B tech marketing leaders, customer success stories ranked as the single most convincing proof format for B2B buyers.
Not every team can build these skills in-house. If you plan to hire out, start with our list of video marketing agencies.
Video Ad Spending and Market Size
The money behind video marketing tells a clear story: budgets are growing, digital has overtaken traditional TV, and short-form ad spend is accelerating globally.
29. Global digital video advertising spend reached $214.76 billion in 2025. That figure is projected to hit $338.64 billion by 2030, growing at a compound annual rate of 9.54%, according to Statista.
30. U.S. businesses now spend more on digital video ads ($85 billion) than traditional TV ($59 billion). Digital video advertising has officially overtaken broadcast in the United States, per Statista data. The gap continues to widen as more marketers shift budgets to online channels.
31. U.S. social video ad spend will reach $31.9 billion in 2026, overtaking connected TV for the first time. Growing 13% year-over-year against CTV’s 11%, social video reflects the audience migration to short-form platforms like TikTok, Instagram Reels, and YouTube Shorts, according to the IAB.
32. 46% of marketers allocate a third or less of their total budget to video. Despite video’s proven effectiveness, most marketing teams still underinvest relative to results. According to the State of Video Marketing report, 17% of marketers do not track their video spend at all.
33. 92% of marketers plan to maintain or increase video spending in 2026. According to the State of Video Marketing report, only 3% plan to decrease video spend, making it one of the most resilient line items in marketing budgets. Video stays protected even as other channels face cuts.
34. 41% of marketers have invested in paid video placements this year. The State of Video Marketing report shows paid video distribution jumped from 36% the previous year, as platforms like YouTube, LinkedIn, and Instagram offer more sophisticated targeting and attribution tools.
35. Video production costs are split: 38% say increasing, 32% say stable, 30% say decreasing. Per the State of Video Marketing report, the net effect depends on production model and volume. AI tools push costs down for some workflows, while rising quality expectations push budgets up for others.
36. 62% of YouTube mobile ad time receives active attention, versus 45% for TV. Paid YouTube mobile ads are 84% more likely to be watched than TV ads, according to Ipsos and Google eye-tracking research. This aligns with the broader shift in ad spend toward digital video channels.
Platform Performance
Every major platform now supports video, but not every platform delivers equal results. Here is where businesses are posting video content and which channels drive the strongest marketing outcomes.
37. YouTube remains the most widely used video marketing channel, with 82% of businesses posting there. According to the State of Video Marketing report, YouTube has held the top position for over a decade, though its lead is narrowing.
38. 78% of marketers say YouTube is the most effective video platform. YouTube’s searchability, long-form hosting, and ad ecosystem give it a unique advantage for evergreen video content and paid distribution. For the full platform breakdown, see our YouTube marketing statistics.
39. LinkedIn has surged to 70% usage among video marketers. LinkedIn is now the second most-used video marketing channel, up significantly from prior years. For B2B brands, this is the most important platform shift in 2026. See our LinkedIn video statistics for the full breakdown.
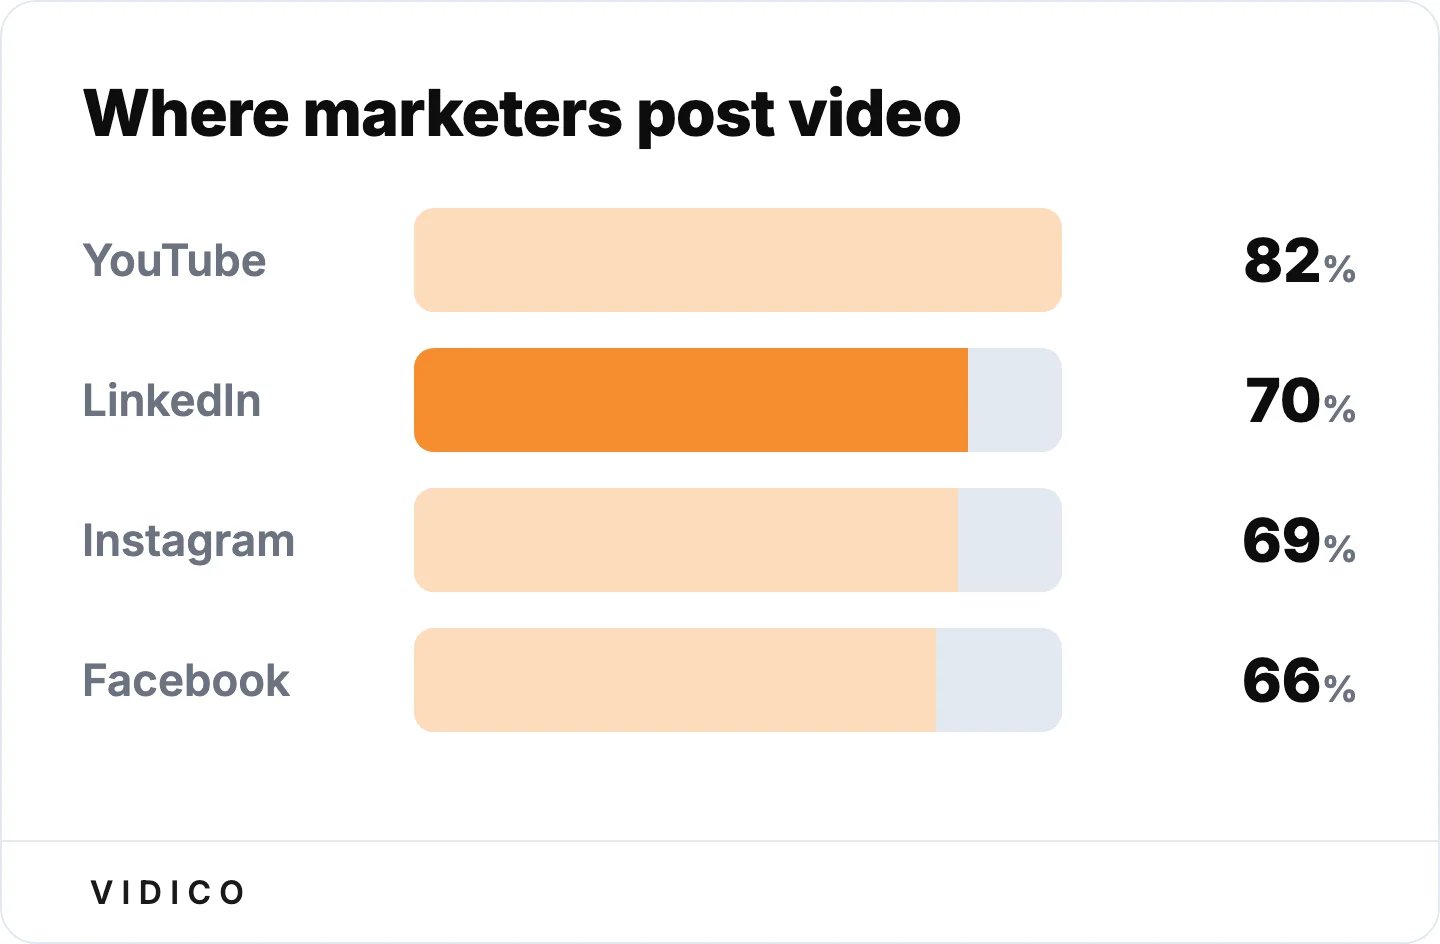
LinkedIn has surged to second place, closing in on YouTube among video marketers. Source: State of Video Marketing report.
40. 81% of B2B teams share video on LinkedIn, making it the top B2B distribution channel. According to Wistia’s State of Video Report, LinkedIn has overtaken YouTube as the primary video channel for B2B marketing teams for the first time.
41. Instagram is used by 69% of video marketers. Instagram Reels and Stories drive high engagement for consumer-facing brands, though B2B adoption trails consumer. See our Instagram Reels statistics.
42. Facebook is used by 66% of video marketers. Despite declining organic reach, 71% of marketers still find Facebook video effective for reaching broad audiences and driving social commerce conversions. See our Facebook video statistics.
43. 52% of marketers find TikTok videos effective. TikTok’s engagement rate (3.70%) leads all social platforms, and over 50% of TikTok users have made a purchase after watching a TikTok LIVE, according to Sprout Social.
44. Video ranks among the most-shared content types on LinkedIn. That shareability makes LinkedIn video a high-impact format for B2B thought leadership and demand generation.
45. Tweets with video get 10 times more engagement than tweets without. Video content on X (formerly Twitter) drives dramatically higher interaction rates, making it a high-ROI format even on a text-first platform, per Sprout Social data.
46. Social media video is the most popular use case at 69%. Social video tops all other formats, followed by explainer videos at 68%, video testimonials at 57%, presentation videos at 48%, and paid ads at 48%.
AI in Video Marketing
AI adoption in video marketing accelerated sharply in 2026. The data below covers tool usage, workflow impact, governance gaps, and what AI does and does not replace in the creative process.
47. 63% of video marketers have used AI tools for video creation or editing. This figure jumped from 51% the year prior, according to the State of Video Marketing report. AI adoption in video has crossed the majority threshold.
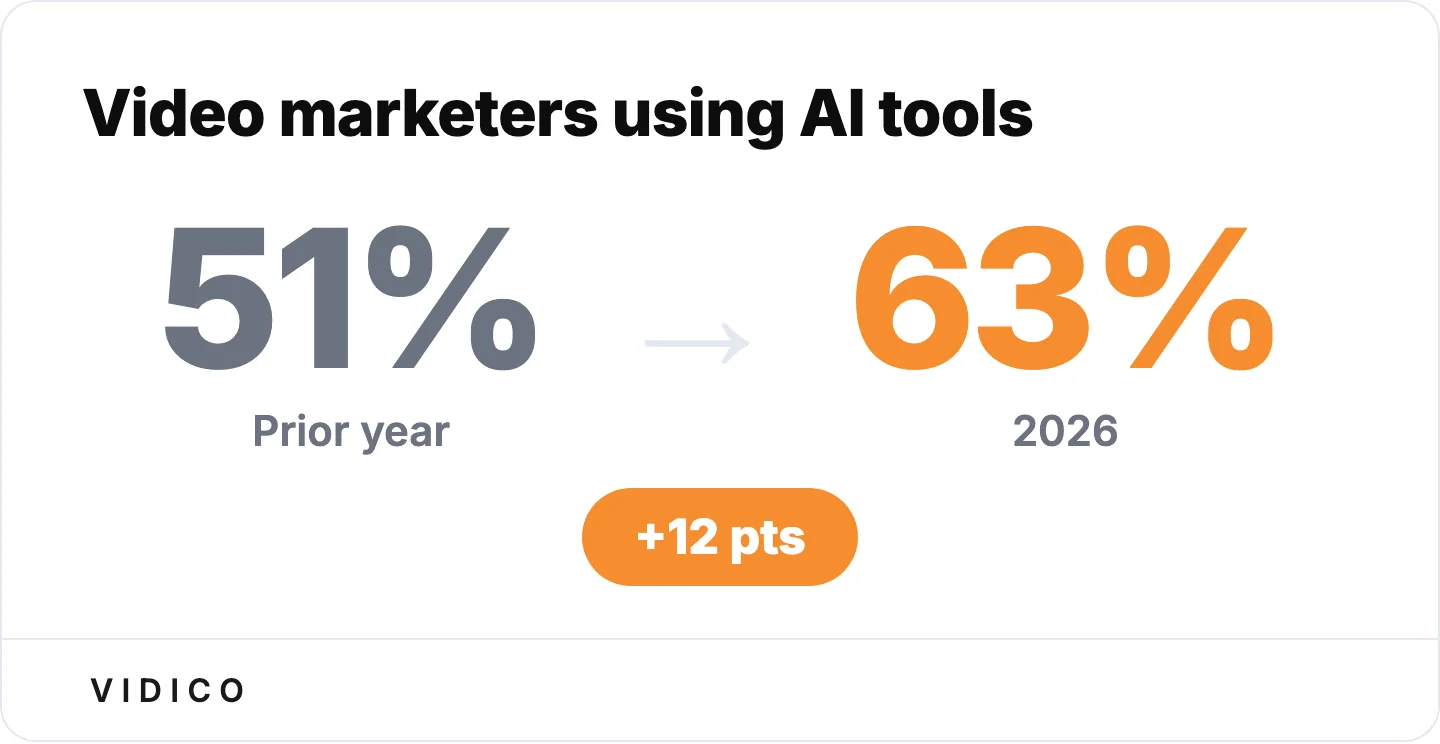
AI adoption in video crossed the majority threshold in a single year. Source: State of Video Marketing report.
48. AI has the most impact on mid-process production tasks. According to Wistia’s research, daily video producers are 58% more likely to use AI. The primary use cases are script drafts, subtitle generation, repurposing long-form into short-form, and asset tagging. The brief and final deliverable remain human-led.
49. Final creative copy is the most protected output from AI. In Vidico’s 2026 State of Creative in Tech report, B2B tech marketing leaders identified final copy as the area where they least want AI making decisions. The creative brief and final review stay human.
50. Accuracy is the number one AI risk concern. B2B marketers cite accuracy and factual correctness as their top worry about AI-generated content, ahead of brand consistency and legal compliance, per Vidico’s survey of 230+ B2B tech marketing leaders.
51. Only 29% of B2B tech teams have a formalized AI governance policy. Nearly half are still building one, according to Vidico’s 2026 report. This governance gap creates risk as AI adoption accelerates ahead of internal policy.
52. AI users are significantly more likely to include multilingual subtitles. According to Wistia’s data, teams using AI produce more accessible content, particularly through automated caption and localization features.
53. Marketers broadly expect AI-driven personalization to reshape customer experience. The expectation is near-universal in industry surveys, though actual implementation still trails intent. Personalized video is moving from edge case to standard practice.
54. 42% of B2B tech marketers say getting audience attention is harder now. In Vidico’s 2026 State of Creative in Tech report, increased competition and content sameness were cited as the primary drivers. Differentiation now edges out efficiency as the top priority for 2026.
Video Content Types and Formats
Video format strategy matters as much as the content itself. The data below covers which video types marketers produce, optimal lengths, and how format trends are shifting in 2026.
55. Live-action is the most commonly created video type at 51%. More than half of video marketers focus on live-action content, followed by animated videos at 23% and screen-recorded content at 19%. For brands competing in crowded feeds, animation offers a distinct opportunity to stand out.
56. 68% of marketers create explainer videos. Explainer videos remain a top format for reducing buyer friction, especially for SaaS and tech products where software walkthroughs can directly influence conversion.
57. Testimonial videos are trending sharply upward: from 17% in 2023 to 47% in 2026. According to Wistia’s State of Video Report, customer testimonials are now the fastest-growing video format. Testimonial video production has become a standard line item in B2B marketing budgets.
58. Short-form videos between 30 and 60 seconds are considered most effective by 71% of marketers. Short-form captures attention in feed-based environments. For platform-specific data, see our short-form video statistics.
59. Average video length has decreased 75% since 2016. According to research, the average marketing video dropped from 168 seconds to 76 seconds. Projected average for 2026: 39 seconds.
60. 48% of marketers create presentation videos. Presentation-style video is one of the fastest-growing formats as remote selling and virtual events become permanent. Video-enhanced presentations outperform static slides in engagement and recall. See our presentation design services.
B2B Video Marketing
B2B buyers rely on video content at every stage of the purchasing process. The data below tracks B2B-specific adoption, platform shifts, and emerging trends that separate B2B video strategy from consumer approaches.
61. B2B marketers consistently rank video among the highest-ROI content types. When tech buyers evaluate solutions, video cuts through the noise faster than text, case studies, or webinars. That is why video keeps gaining share of B2B content budgets.
62. 50% of B2B buyers rely on video content for purchasing decisions. Half of business purchasers use video during their evaluation process, making it essential across the entire B2B funnel. For the full breakdown, see our B2B video marketing statistics.
63. 89% of B2B marketers distribute video via social media. According to the Content Marketing Institute, social platforms are now the default distribution channel for B2B video, ahead of email, owned websites, and paid channels.
64. Mid-form video is now the leading content format for B2B. In Vidico’s 2026 State of Creative in Tech report, mid-form video edged out short-form and long-form as the top-performing format by a slim margin. Paid social video and customer-proof video were tied as the highest-impact formats.
65. 76% of B2B tech marketers say their creative production budget is increasing. According to Vidico’s survey of 230+ B2B tech marketing leaders, creative budgets are growing even as total marketing budgets face scrutiny. When budgets tighten, brand campaigns and creative experimentation get cut first; always-on content volume is most protected.
66. 65% of B2B tech teams run structured creative experimentation at least monthly. Testing cadence is now the norm, not the exception. Most-tested variables: audience segment (44.9%), message angle (39.3%), and hook or opening (38.0%), per Vidico’s 2026 report.
67. Differentiation is now the top priority for B2B creative teams. In Vidico’s 2026 research, differentiation edged out efficiency as the number-one goal. With 35% of marketers citing creative fatigue as a growing problem, standing out matters more than producing faster.
Video Marketing Challenges
Producing enough video, fast enough, at the right quality remains the central challenge. These are the barriers marketers report in 2026.
68. 33% of marketers cite lack of time as the top barrier to video marketing. According to the State of Video Marketing report, time constraints remain the single biggest obstacle, especially for teams producing multiple video types across several platforms simultaneously.
69. 20% of marketers find video marketing too expensive. The State of Video Marketing report shows cost concerns decreasing over the past three years as AI tools, template-based production, and subscription models make video more accessible.
70. 15% of marketers do not know where to start with video. This figure has held stable in the State of Video Marketing report, suggesting a persistent knowledge gap for marketing teams without dedicated video experience.
71. 12% of marketers say ROI measurement for video is unclear. According to the State of Video Marketing report, attribution remains a challenge, particularly for top-of-funnel brand videos where the impact on pipeline is indirect and hard to track across sessions.
72. Budget is the biggest single constraint, at 27.4%. According to Vidico’s 2026 State of Creative in Tech report, budget leads the constraint list, followed by measurement and attribution (14.1%), slow internal approvals (13.2%), and bandwidth or headcount (12.8%).
FAQs
What percentage of businesses use video marketing in 2026?
According to the State of Video Marketing report, 91% of businesses use video as a marketing tool in 2026, matching the all-time high set in 2024. Additionally, 93% of video marketers consider video an important part of their overall strategy. Only 5% of businesses have no plans to use video at all.
What is the ROI of video marketing?
According to the State of Video Marketing report, 82% of video marketers report that video provides a good ROI. This dropped from 93% the prior year, but the decline reflects higher attribution expectations, not reduced effectiveness. 85% say video generates leads, 83% say it directly increases sales, and 82% say it increases time spent on their website.
How does AI impact video marketing in 2026?
63% of video marketers now use AI tools for creation or editing, up from 51% the year before. AI is primarily used in mid-production tasks like script drafts, subtitle generation, and repurposing content. The creative brief and final deliverables remain human-led. Only 29% of B2B tech teams have a formal AI governance policy, per Vidico’s 2026 State of Creative in Tech report.
What is the best video length for marketing?
71% of marketers consider videos between 30 and 60 seconds the most effective length. Average marketing video length has dropped 75% since 2016, from 168 seconds to 76 seconds. However, Wistia’s data shows that longer videos (30 to 60 minutes) drive the highest conversion rates at 17%, particularly for webinars and extended product demonstrations.
Which social media platform is best for video marketing?
YouTube is the most widely used video marketing platform (82% of businesses) and the most effective (78% of marketers agree). For B2B specifically, LinkedIn has overtaken YouTube as the top distribution channel, with 81% of B2B teams sharing video there. TikTok leads on engagement rate (3.70%), while Instagram (69%) and Facebook (66%) remain strong for consumer-facing brands.
Conclusion
These video marketing statistics confirm what the numbers have been showing for several years: video is the highest-performing content format across adoption, engagement, conversion, and retention metrics. What has changed in 2026 is the speed at which AI tools are reshaping production workflows, the emergence of LinkedIn as the dominant B2B video channel, and the rising bar for what counts as “good ROI.”
Vidico produces B2B explainer video campaigns on a subscription model, with a reusable template system that makes every project faster than the last. Across 2,000+ campaigns for brands like Airtable, Square, and Spotify, we have seen these statistics play out in real production environments. The brands that outperform are the ones building repeatable systems, not treating each video as a standalone project.
We run marketing video production as a monthly service, not one project at a time.
Ready to build a video strategy that compounds? Book a free strategy session to see how a systems-based production approach can help your team reach the volume and quality these benchmarks demand.
Sources
- Wistia: State of Video Report
- Statista: Digital Video Advertising Worldwide
- Statista: TV and Digital Video Ad Spending in the U.S.
- Idomoo: State of Video Technology Report
- Sprout Social: Social Media Statistics
- Content Marketing Institute: B2B Content Marketing Trends
- Ipsos: Google Advertising Attention Research
- IAB: U.S. Digital Video Ad Spend Forecast