Short-form video is vertical video under roughly 60 seconds, made for TikTok, Instagram Reels, YouTube Shorts and Facebook Reels. In Australia, 63% of people watch it weekly, TikTok now reaches 10.9 million adults, and video advertising has grown to A$5.4 billion a year.
Most Australian statistics on this topic cannot be traced back to anyone. A surprising number of them are not Australian at all, but United States or global figures relabelled. Every figure below carries a named source, a publication year and the geography it actually covers. Six widely-repeated numbers did not survive that check. This page carried all six of them, and we have named each one and explained the problem rather than quietly deleting them.
Key Takeaways
- 63% of Australians watch short-form video weekly, a figure that comes from Meta Australia’s research and is now three years old, which makes it the oldest headline statistic on this topic
- TikTok reaches 10.9 million Australian adults and grew 13.9% year on year, the fastest growth of any major platform in the country
- Australian video advertising reached A$5.4 billion in calendar 2025, up 19.8%, and now accounts for 29% of all online advertising spend
- 4.7 million under-16 accounts were removed in December 2025 under Australia’s new minimum-age law, which means every audience figure measured before that date is now historical
- Short-form video ranks first for return on investment at 49%, ahead of long-form video at 29% and live-streaming at 25%
- Engagement rates are far lower than commonly reported. Current benchmarks put TikTok at 2.60% and Instagram Reels at 0.48%, well below the 5.91% and 5.75% figures that circulate widely
Content
How Australians Use Short-Form Video
Australia is one of the most connected countries in the world, and short-form video now takes a larger share of that connected time than any other content format.
1. 97.1% of Australians are online
26.2 million Australians use the internet, out of a total population of 27.0 million, according to DataReportal’s Australia digital report. Data as at October 2025. Australia.
2. 21.0 million Australians hold social media identities
That is 77.7% of the total population, per DataReportal. One important caveat applies to this and every platform figure below: these are advertising-platform reach estimates, not verified monthly active users. Ad reach typically runs 30% to 60% above verified user counts. Australia.
3. 63% of Australians watch short-form video weekly
This figure comes from Meta Australia’s “Shift to Short” research, with the Australian study conducted by Hoop Group and reported by Mediaweek. Published 2023. Australia. It is the most-quoted short-form statistic in the Australian market and also the oldest, which is worth knowing before anyone builds a 2026 media plan on it.
4. Australians spend 1 hour 14 minutes a day on TikTok
TikTok records the highest daily time of any social platform in Australia, according to Meltwater’s Australian social media data. Published 2026. Australia.
5. Australians spend 1 hour 12 minutes a day on YouTube
YouTube sits two minutes behind TikTok on daily time, per Meltwater. Published 2026. Australia.
6. Australians spend 1 hour 3 minutes a day on Instagram
Instagram ranks third on daily time in Australia, per Meltwater. Published 2026. Australia.
7. Australians spend 46 minutes a day on Facebook
Facebook holds the largest Australian audience but the shortest session time of the four major video platforms, per Meltwater. Published 2026. Australia.
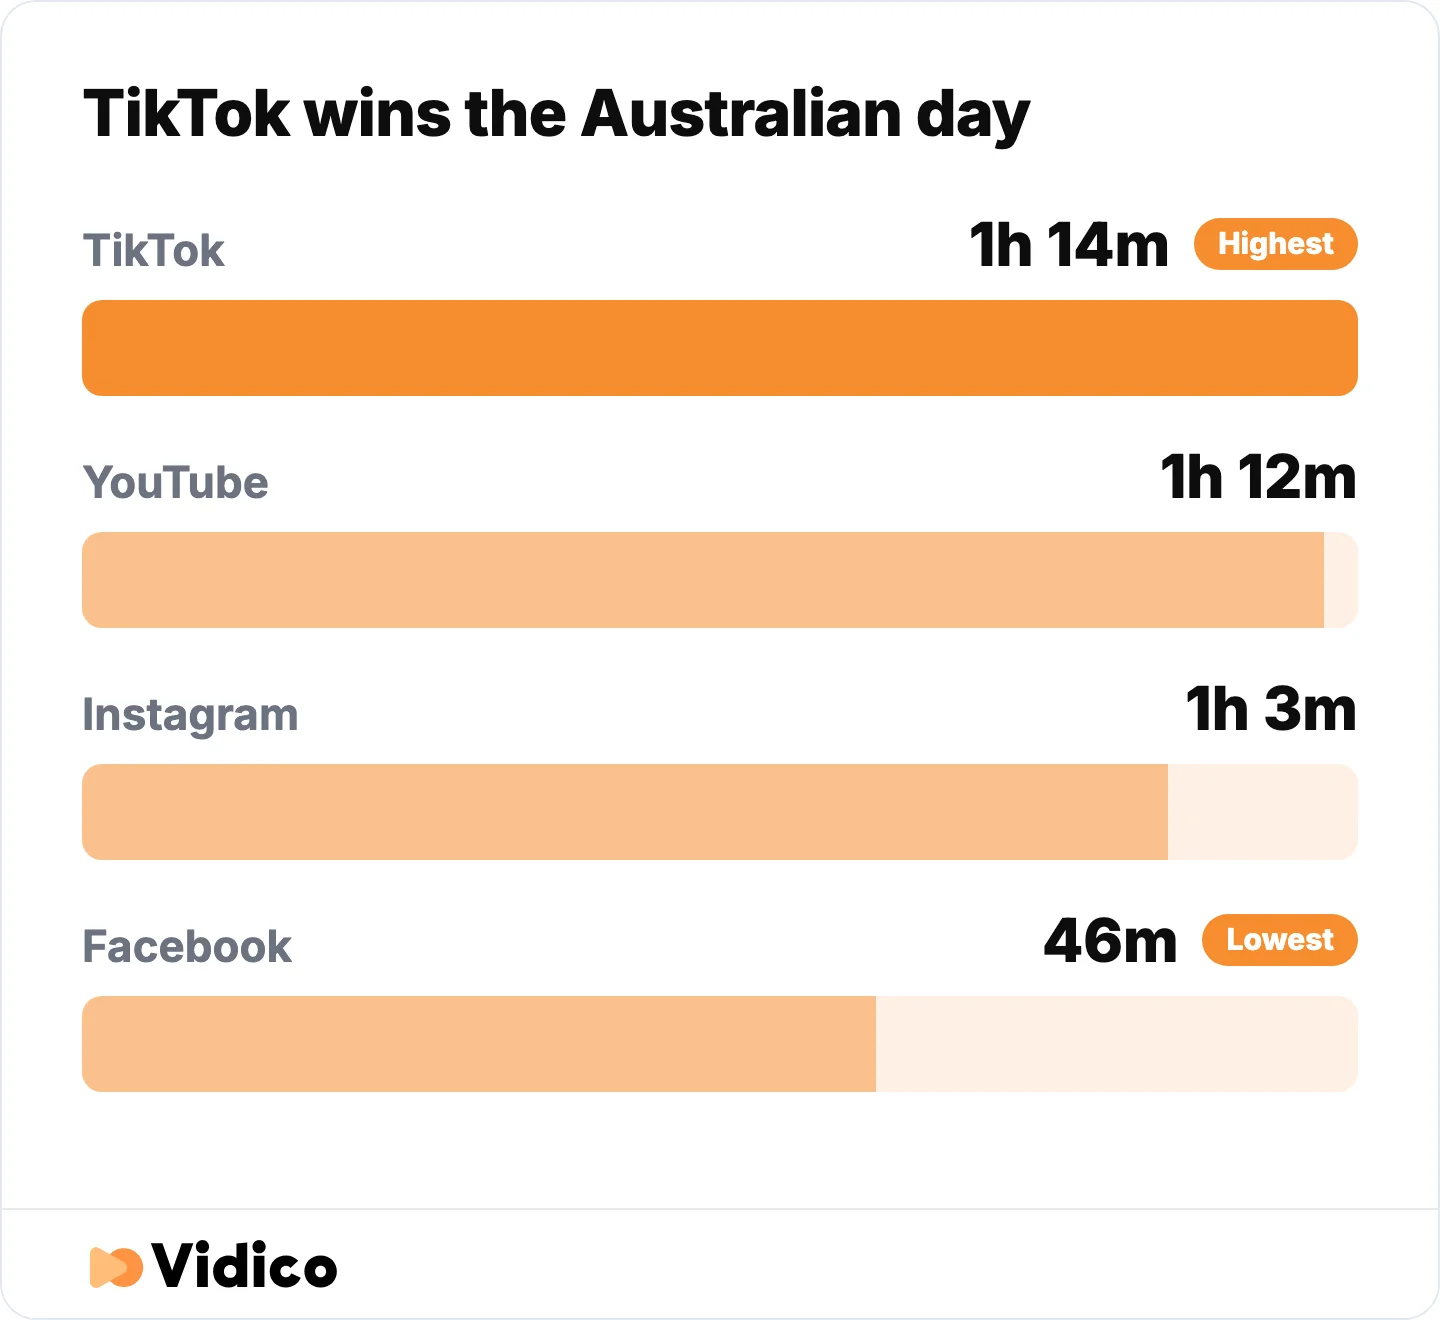
TikTok takes more of an Australian’s day than any other platform, while Facebook holds the largest audience and the shortest sessions. Source: Meltwater, 2026.
8. 33.8% of Australians use social networks to research brands
A third of Australian internet users now treat social platforms as a research channel rather than an entertainment channel, per DataReportal. Data as at October 2025. Australia.
9. Facebook reaches 17.7 million Australians
That is 65.3% of the population, up 4.4% or 750,000 people year on year, per DataReportal. Data as at October 2025. Australia.
10. Video accounts for 38% of global internet traffic
Video is the largest single traffic category by volume, measured at 38% of total traffic, 39% on fixed networks and 31% on mobile, in the AppLogic Networks Global Internet Phenomena Report. Published 2024. Global. This is a measured figure, not a forecast, which matters given how often a much larger number gets quoted instead.
11. Video’s downstream share runs between 41% and 48% by region
In the Americas video reaches 48% of downstream traffic, per AppLogic Networks. Published 2024. Global.
TikTok Statistics for Australia
TikTok is the fastest-growing major platform in Australia and the only one with a published, independently modelled estimate of its economic contribution to Australian business. For platform-level detail beyond short-form, see our TikTok statistics for Australia.
12. TikTok reaches 10.9 million Australian adults
That is 51.2% of the adult population, per DataReportal. Data as at October 2025. Australia. Figures of 8.0 to 8.5 million still circulate widely in Australian marketing content. Those come from the previous year’s data.
13. TikTok grew 13.9% year on year in Australia
The platform added 1.33 million Australian adults in twelve months, the fastest growth of any major platform in the country, per DataReportal. Data as at October 2025. Australia.
14. 86% of Australians aged 15 to 29 use TikTok for search weekly
Younger Australians now use TikTok as a search engine on a weekly basis, according to WARC data published by Sprout Social. Published 2026. Australia.
15. More than 350,000 Australian businesses use TikTok
This figure comes from Oxford Economics’ study of TikTok’s socio-economic impact in Australia, covering FY23. Published 2024. Australia. The study was commissioned by TikTok, which is worth stating plainly. The modelling is Oxford Economics’ own, but the funding relationship is real and readers deserve to weigh it.
16. TikTok generated A$1 billion in direct revenue for Australian businesses
Measured across FY23, per Oxford Economics. Published 2024. Australia.
17. TikTok contributed A$1.1 billion to Australian GDP
Per Oxford Economics, covering FY23. Published 2024. Australia.
18. TikTok supported 13,000 Australian jobs
Per Oxford Economics, covering FY23. Published 2024. Australia.
19. 78% of Australian business respondents said TikTok expanded their reach
Per Oxford Economics. Published 2024. Australia.
20. 38% of Australian TikTok users buy a recommended product at least monthly
That works out to roughly 3.2 million people, per Oxford Economics. Published 2024. Australia.
21. 41% of Australian TikTok users have visited a recommended restaurant or shop
Roughly 3.5 million people, per Oxford Economics. Published 2024. Australia. This is the clearest available evidence that short-form video moves Australians to physical locations, not just to checkouts.
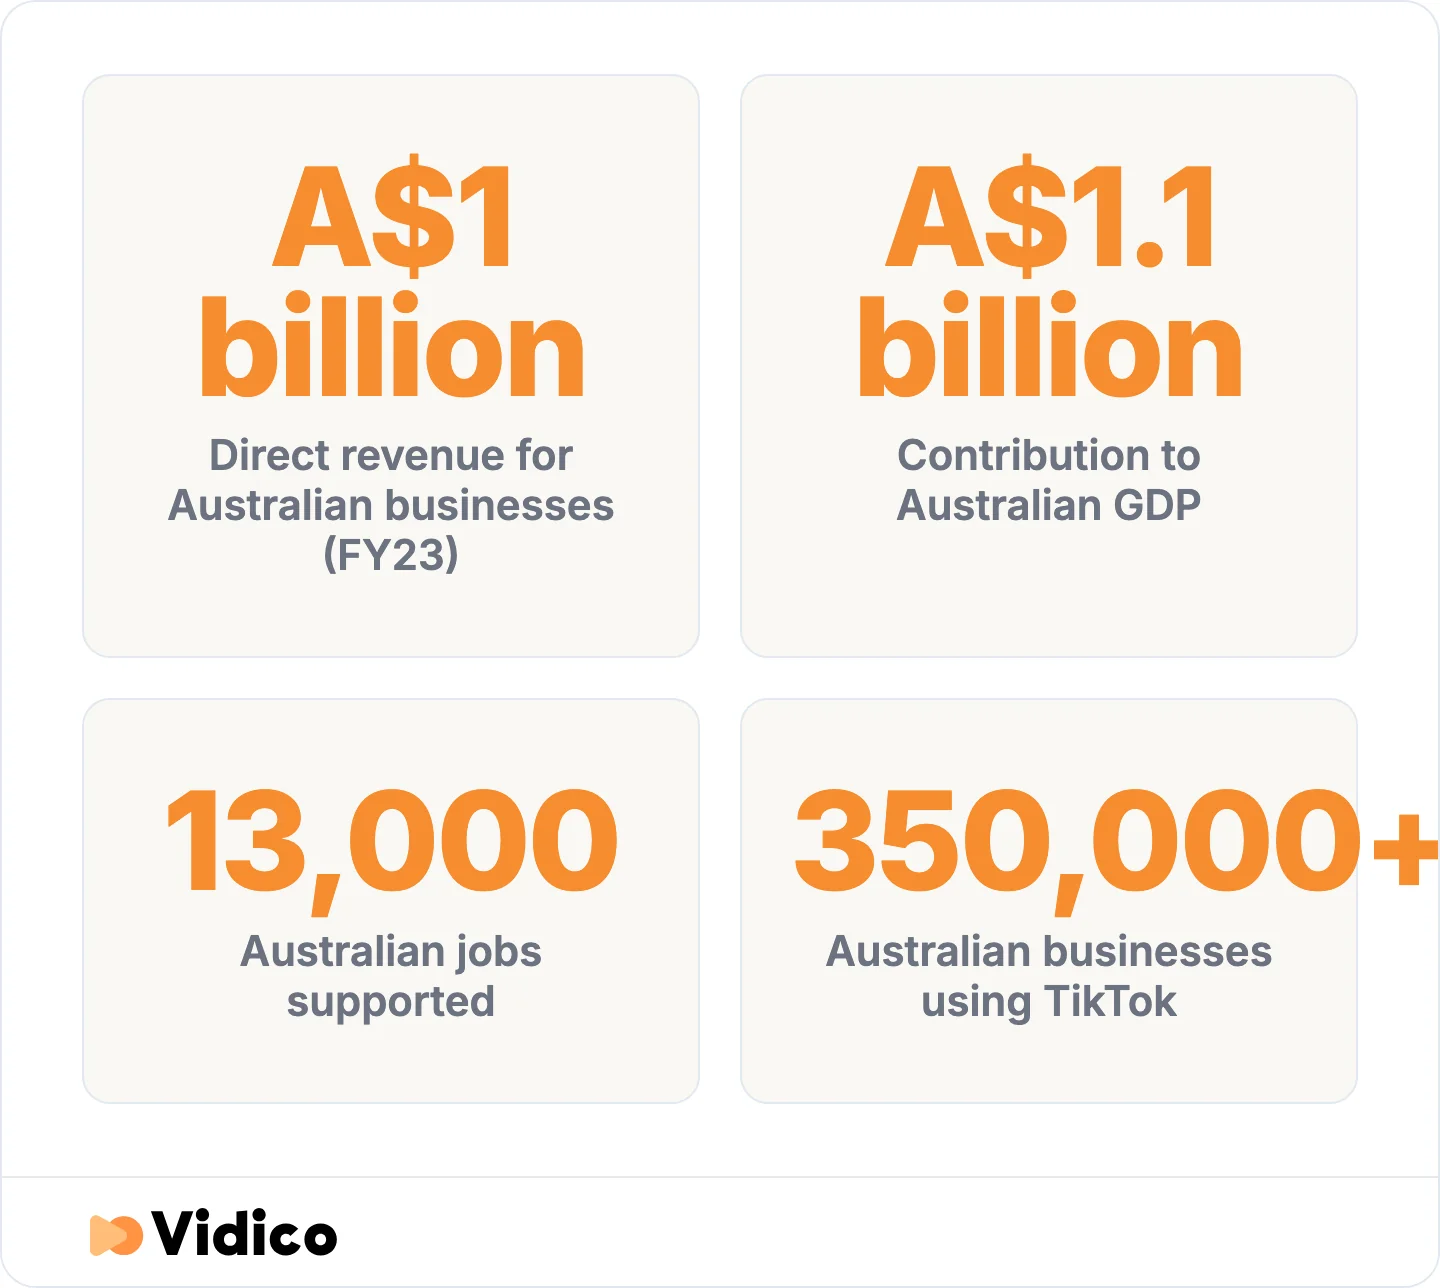
TikTok is the only short-form platform with an independently modelled estimate of what it returns to Australian business. Source: Oxford Economics, 2024, commissioned by TikTok.
Instagram and Reels Statistics for Australia
Instagram holds the second-largest Australian audience, and Reels carries the strongest published purchase-behaviour data of any short-form format in this market. Our Instagram Reels statistics cover the format globally.
22. Instagram reaches 15.2 million Australians
That is 56.0% of the population, per DataReportal. Data as at October 2025. Australia.
23. Instagram grew 8.6% year on year in Australia
The platform added 1.20 million Australians in twelve months, per DataReportal. Data as at October 2025. Australia.
24. 74% of Australian Instagram users purchased after watching a Reel
From Meta Australia’s Shift to Short research. Published 2023. Australia. This is the single strongest purchase-intent figure available for the Australian market, and it is frequently misquoted as a messaging statistic rather than a purchase one.
25. 86% of Australian users followed a business after seeing Reels
Per Meta Australia’s Shift to Short research. Published 2023. Australia.
26. 60% of Australian users messaged a business after watching Reels
Per Meta Australia’s Shift to Short research. Published 2023. Australia. Australian marketing content routinely reports this figure as 74%, which is the purchase number, not the messaging number.
27. 95% of Australian users have shared a Reel with family or friends
Per Meta Australia’s Shift to Short research. Published 2023. Australia.
28. Instagram’s engagement rate by followers is 0.45%
Measured across 70 million posts in Socialinsider’s social media benchmarks. Published 2026. Global. Engagement rate here means engagements divided by followers, which is the methodology most benchmark studies use and most marketing content fails to state.
29. Instagram Reels sit at 0.48%, down from 0.50%
Reels engagement fell quarter on quarter, per Socialinsider. Published 2026. Global.
YouTube and Shorts Statistics for Australia
YouTube reaches more Australians than any other platform. Shorts-specific Australian figures, however, are not published by anyone, and pages that quote one are usually reporting YouTube’s total reach instead. Our YouTube marketing statistics go deeper on the platform.
30. YouTube reaches 21.0 million Australians
That is 77.7% of the population, making YouTube the largest single platform in Australia by reach, per DataReportal. Data as at October 2025. Australia. This figure is identical to Australia’s total count of active social media identities, which is not a transcription error. YouTube’s reach in Australia effectively matches the entire social media population.
31. YouTube Shorts records more than 200 billion daily views globally
Stated by YouTube chief executive Neal Mohan in his Cannes Lions keynote, reported by Search Engine Journal. Published 2025. Global.
32. YouTube’s previous published figure was 70 billion daily Shorts views
Before the 200 billion figure, the most recent number YouTube had published for Shorts was 70 billion daily views, reported in March 2024, per Search Engine Journal. Published 2025. Global. The 70 billion and 200 billion figures are not measured the same way. YouTube changed how Shorts views are counted on 31 March 2025, and a view now registers whenever a Short starts to play or replay, with no minimum watch time. The apparent growth between the two figures is therefore not like for like, and no page we reviewed discloses this.
33. Shorts had 2 billion monthly active users as of 2023
This remains the most recent official monthly user figure YouTube has published for Shorts. Published 2023. Global. It is three years old and is often presented as current.
On Australian Shorts figures: there is no published YouTube Shorts user count for Australia. Claims that Shorts “reaches 85% of the Australian internet population” are describing YouTube’s total Australian reach, not Shorts. We have used YouTube’s total Australian reach of 21.0 million people, or 77.7% of the population, and left the Shorts-specific gap open rather than filling it with a borrowed number.
Australia’s Under-16 Social Media Ban
Australia removed 4.7 million under-16 social media accounts in December 2025. This is the single most important development for anyone reading Australian audience statistics, because it means every platform figure measured before December 2025 describes a population that no longer exists in the same form.
34. The minimum-age law took effect on 10 December 2025
From that date, age-restricted platforms must take reasonable steps to prevent Australians under 16 from creating or keeping an account, per the eSafety Commissioner. Published 2026. Australia. The legislation is the Online Safety Amendment (Social Media Minimum Age) Act 2024.
35. 4.7 million under-16 accounts were removed by mid-December 2025
Age-restricted platforms removed access to 4.7 million Australian under-16 accounts, per the eSafety Commissioner. Published 2026. Australia.
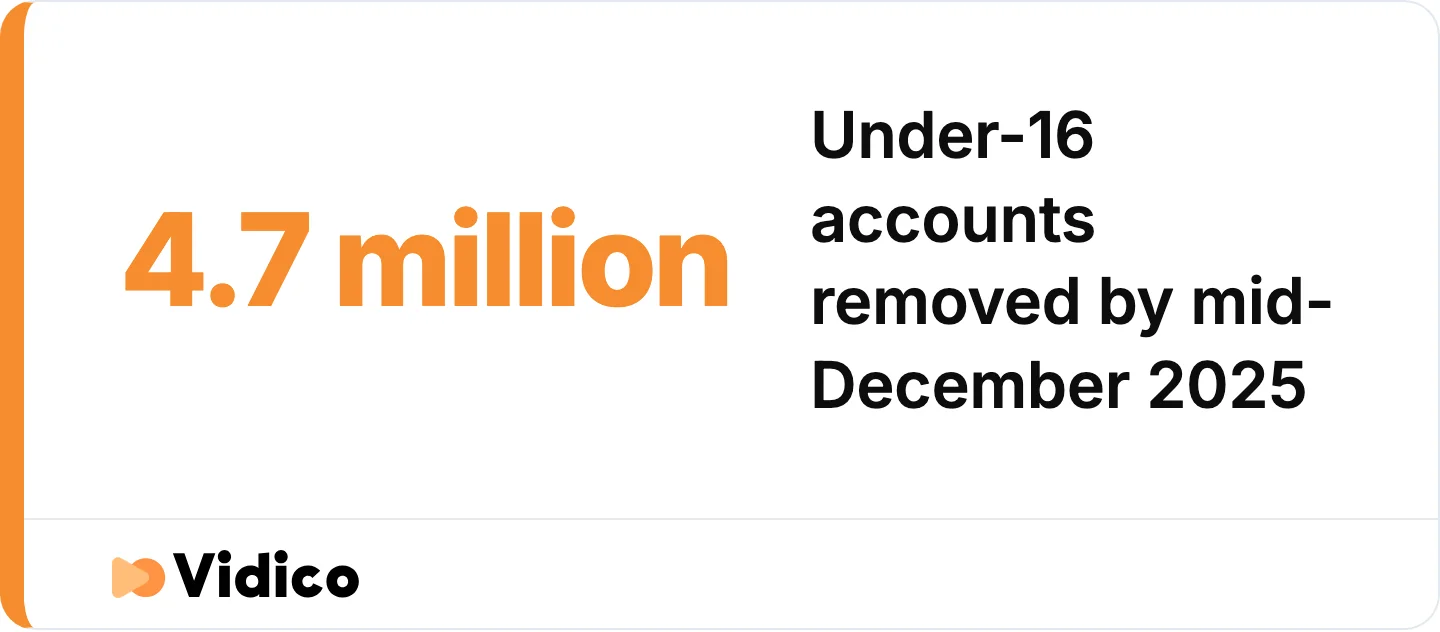
Every Australian audience figure measured before December 2025 now describes a population that changed. Source: eSafety Commissioner, 2026.
36. Platforms face a maximum penalty of A$49.5 million
The maximum penalty is 150,000 penalty units, currently A$49.5 million, per the eSafety Commissioner. Published 2026. Australia.
37. 10 platforms are age-restricted under the law
Facebook, Instagram, Snapchat, Threads, TikTok, Twitch, X, YouTube, Kick and Reddit are all named as age-restricted by the eSafety Commissioner. Published 2026. Australia.
What this means for the numbers on this page. Every Australian platform figure on this page, including TikTok’s 10.9 million adults, Instagram’s 15.2 million and YouTube’s 21.0 million, is dated as at October 2025, which is before the removals took effect. They are accurate as measurements and they are now historical as audience estimates. The eSafety Commissioner published a compliance update covering the first three months in March 2026, and an independent statutory review must begin within two years of 10 December 2025. Anyone planning Australian short-form spend for the next twelve months should treat pre-December 2025 audience figures as a ceiling rather than a current state, particularly for platforms with young skews.
Video Advertising Spend in Australia
Video is the fastest-growing segment of Australian digital advertising and has been for several reporting periods. For what production itself costs in this market, see our guide to video production rates in Australia.
38. Australian internet advertising reached A$18.4 billion in 2025
Total spend grew 11.5% year on year across the full calendar year, according to IAB Australia’s online advertising expenditure report, prepared by PwC Australia. Published 2026. Australia.
39. Video advertising reached A$5.4 billion, up 19.8%
Video was the strongest-performing segment of Australian digital advertising in calendar 2025, per IAB Australia. Published 2026. Australia. Note the reporting basis: IAB Australia reports on a calendar year, not a financial year, and figures presented as “FY2025” for this data are mislabelled.
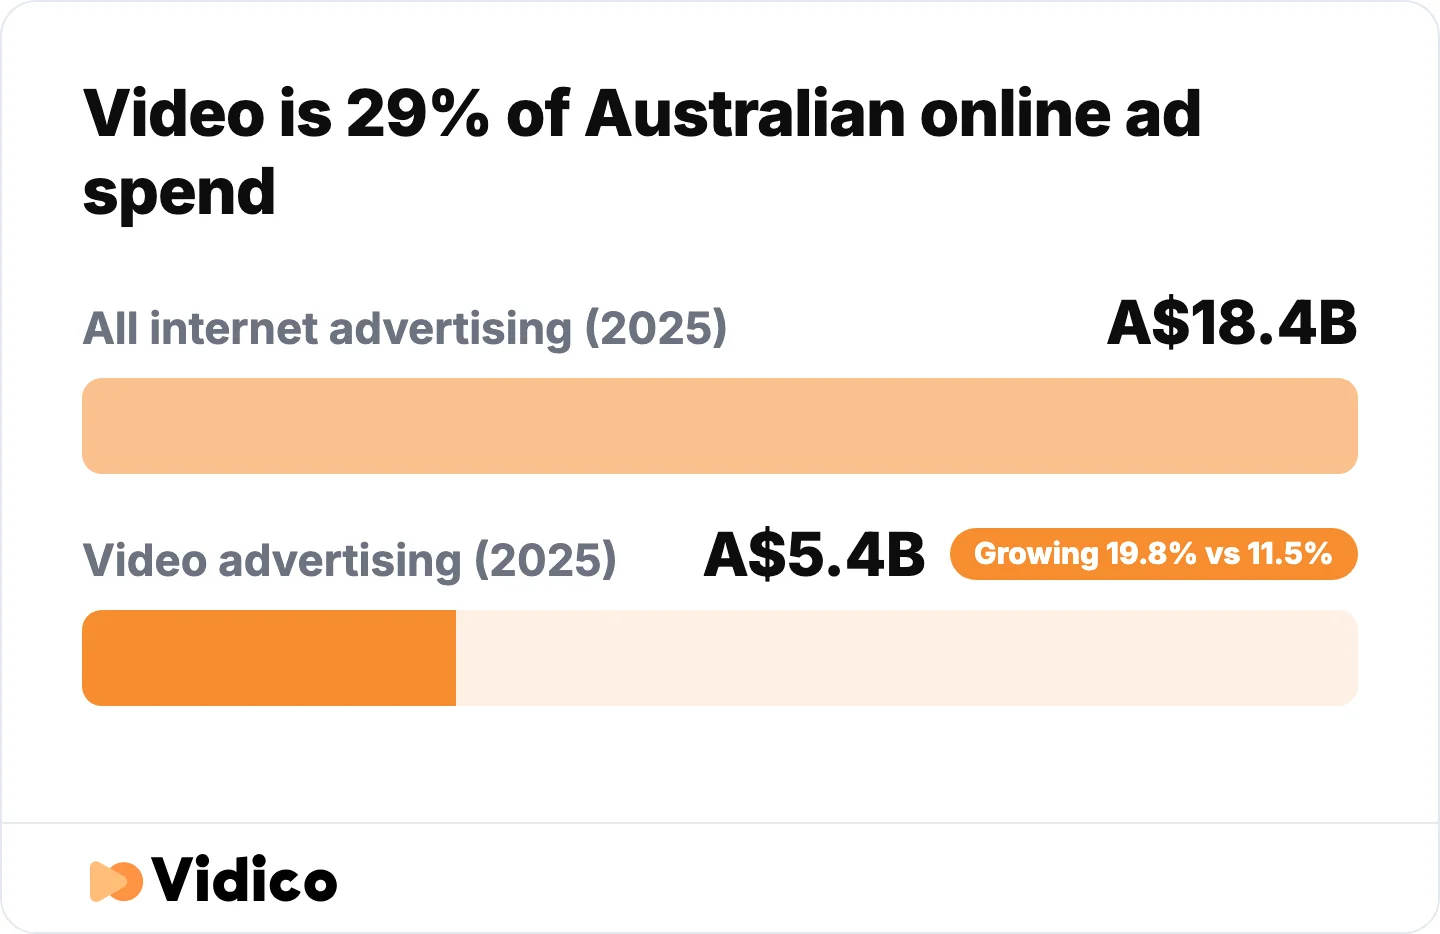
Video is now 29% of all Australian online ad spend and the fastest-growing segment in the market. Source: IAB Australia, prepared by PwC Australia, 2026.
40. Video is 29% of all Australian online advertising expenditure
Per IAB Australia. Published 2026. Australia.
41. Video advertising hit A$1.4 billion in the first quarter of 2026, up 20.4%
Video remained the fastest-growing major segment into 2026, per IAB Australia’s advertising expenditure data. Published 2026. Australia.
Engagement and Return on Investment
Engagement benchmarks are the most commonly misreported statistics in short-form video. The figures below state their methodology and sample, which is what makes them comparable.
42. TikTok’s engagement rate by followers is 2.60%
Measured across 70 million posts by Socialinsider, which notes TikTok is at its lowest values in 18 months. Published 2026. Global.
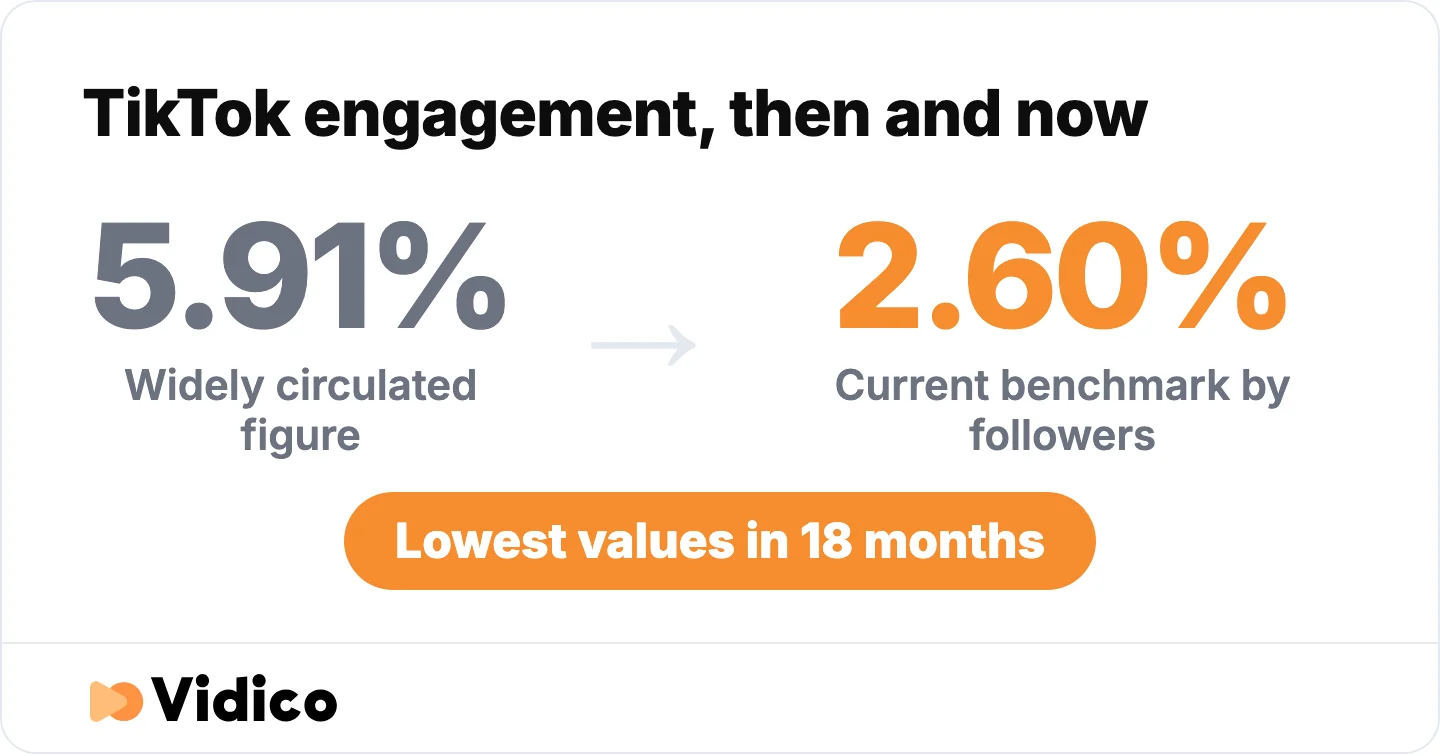
The TikTok engagement rate most Australian marketing content quotes is more than double the current measured benchmark. Source: Socialinsider, 70 million posts, 2026.
43. Facebook’s engagement rate by followers is 0.13%
Per Socialinsider. Published 2026. Global.
44. X sits at 0.10%
Per Socialinsider. Published 2026. Global.
45. The benchmark set covers 70 million posts
Socialinsider’s benchmarks draw on 70 million posts published between January 2024 and December 2025. Published 2026. Global. Socialinsider discloses that the study contains 2025 values presented as 2026, because there was not enough 2026 data at publication. That disclosure is the reason these figures are usable and the reason we have not rounded them into something cleaner.
46. Short-form video is the top return-on-investment content format at 49%
Per HubSpot’s State of Marketing research. Published 2026. Global.
47. Long-form video ranks second at 29%
Per HubSpot. Published 2026. Global.
48. Live-streaming video ranks third at 25%
Per HubSpot. Published 2026. Global.
49. 93% of marketers say video is an important part of their strategy
Per HubSpot. Published 2026. Global. This figure is frequently reported as “93% report positive return on investment”, which is a different claim that HubSpot does not make.
50. 37% of marketers are increasing video investment
Per HubSpot. Published 2026. Global.
Short-Form vs Long-Form Video
Short-form video wins on reported return on investment, at 49% against long-form’s 29% in HubSpot’s data. The picture for business-to-business teams is less one-sided, and it is worth separating the two.
The consumer case for short-form is settled. It carries the highest reported return, it holds the largest share of daily platform time in Australia, and it is the only format with published Australian purchase-behaviour data behind it.
The business-to-business case has moved. In Vidico’s 2026 State of Creative in Tech report, a survey of more than 230 business-to-business technology marketing leaders, short-form is described as having had its moment, with teams now running deliberate, balanced format mixes rather than defaulting to short-form for everything. Mid-form video leads for demos, testimonials and product storytelling. Paid social video and customer-proof video are tied as the highest-impact formats for 2026.
That is a genuine split, and it is the reason a single “short-form wins” conclusion does not survive contact with a business-to-business media plan. For a broader view of the format across all markets rather than Australia specifically, see our global short-form video statistics.
51. Concept-to-live timelines run 4 to 14 days for most teams
Per the State of Creative in Tech survey of 230+ business-to-business technology marketing leaders. Published 2026. Global business-to-business. That window is the practical ceiling on how much short-form a team can put into market.
52. Teams running reusable templates compress that window to 1 to 3 days
The speed gap is a systems difference, not a talent difference, per the same survey. Published 2026. Global business-to-business.
53. Only one team in three operates a fully reusable asset system
The majority still build each campaign from scratch, per the State of Creative in Tech survey. Published 2026. Global business-to-business.
Short-Form Video for Business-to-Business Teams
Business-to-business teams face a different constraint from consumer brands. The bottleneck is rarely whether short-form works. It is production capacity and internal approvals.
54. 76% of business-to-business technology marketers say their creative production budget is increasing
Per the State of Creative in Tech report. Published 2026. Global business-to-business.
55. 74% say their total marketing budget is growing
Per the same survey. Published 2026. Global business-to-business.
56. 65% run structured creative experimentation at least monthly
Per the State of Creative in Tech survey. Published 2026. Global business-to-business.
57. 42% say getting attention is harder now
Respondents attribute this to more competition and increasing sameness across creative, per the same survey. Published 2026. Global business-to-business.
58. 35% cite accelerating creative fatigue
Per the same survey. Published 2026. Global business-to-business.
59. Audience and segment is the most-tested creative variable at 44.9%
Message angle follows at 39.3% and hook or opening at 38.0%, per the same survey. Published 2026. Global business-to-business.
Platform Comparison for Australian Marketers
Sources for this table: reach and growth from DataReportal, daily time from Meltwater, engagement rates from Socialinsider, Australian purchase behaviour from Meta Australia, and Australian business revenue from Oxford Economics.
| Platform | Australian reach | YoY growth | Daily time (AU) | Engagement rate (global) | Strongest published evidence |
|---|---|---|---|---|---|
| YouTube | 21.0M (77.7%) | Not published | 1h 12m | Not broken out for Shorts | Largest Australian reach |
| 17.7M (65.3%) | +4.4% | 46m | 0.13% | Broadest demographic reach | |
| 15.2M (56.0%) | +8.6% | 1h 3m | 0.45% overall, 0.48% Reels | 74% purchased after a Reel (AU) | |
| TikTok | 10.9M adults 18+ (51.2% of adults) | +13.9% | 1h 14m | 2.60% | A$1bn revenue for AU businesses |
Reading this table honestly. Reach figures are advertising-platform estimates, not verified users, and run 30% to 60% above verified counts. Engagement rates are global and measured as engagements divided by followers. TikTok’s reach is stated for adults 18+ while the others are stated against total population, because that is how each is published. All Australian figures are as at October 2025, before the December 2025 minimum-age removals.
Statistics We Removed From This Page
This page previously carried six figures that do not hold up, and four of them were not Australian in the first place. We have set out each one because the same numbers appear across most Australian content on this topic, and knowing which figures are unsafe matters more than another list of figures.
“Video accounts for 82% of global internet traffic.” This traces to the Cisco Visual Networking Index, a forecast series Cisco discontinued. It was always a projection rather than a measurement. The measured figure is 38% of total traffic, or 41% to 48% downstream depending on region, per AppLogic Networks.
“Social videos are shared 1,200% more than text and images combined.” Every citation for this points to another citation. No original study, methodology, sample or publication date is findable. It is roughly a decade old and unsourceable.
“87% of marketers report positive return on investment from video.” This traces to a single vendor survey family and no independent primary source exists for it. We have replaced the ROI framing with HubSpot’s format ranking, which names its survey and its year.
“69% of Australians watch short videos with sound off.” This is a 2019 Verizon Media and Publicis Media study of 5,616 United States consumers, and it measured viewing in public places, not general viewing. It is reported by Forbes. It is not Australian, not short-form specific, and not unconditional. Captions still matter. This particular number does not support the claim.
“Engagement rates of 5.91%, 5.75% and 2.07%.” These come from a Q1 2024 dataset and are two to ten times higher than current benchmarks measured on a comparable basis. They are not wrong for their period. They are incompatible with anything published since.
“A$5 billion in video ad spend, up 21.9%, FY2025.” This page published these figures without a source. The correct figures are A$5.4 billion, up 19.8%, for calendar year 2025, per IAB Australia. IAB Australia reports on a calendar basis, so the financial-year framing was wrong as well as the numbers.
How These Figures Were Sourced
Every statistic on this page carries three things: a named source, the year that source published, and the geography the figure actually covers. That last one is where most Australian statistics content fails, because global and United States figures get presented as Australian without anyone stating the swap.
We applied three rules. Primary sources over roundups, so DataReportal, IAB Australia, Oxford Economics, Meta Australia, the eSafety Commissioner and the platforms themselves rather than pages summarising them. Methodology stated where it changes the meaning, which is why advertising reach is separated from verified users, why engagement rates say what they divide by, and why the YouTube Shorts counting change is flagged. Gaps left open rather than filled, which is why there is no Australian YouTube Shorts figure on this page. Nobody publishes one.
Where a figure is old, the year is stated next to it rather than buried. The most-quoted Australian short-form statistic on this topic, the 63% weekly viewing figure, was published in 2023.
Also read: Average Attention Span Statistics
FAQs
What is the best length for short-form video in Australia?
Short-form video runs under roughly 60 seconds, and platform behaviour rather than a single optimal number should drive the decision. There is no reliable Australian study establishing an optimal length, and figures circulating on this topic, such as specific completion rates for 50 to 60 second videos, do not trace to a published source. Use the format constraints of the platform you are publishing to.
Which platform has the highest engagement rate for short-form video?
TikTok leads current benchmarks at 2.60% engagement by followers, ahead of Instagram at 0.45%, Instagram Reels at 0.48%, Facebook at 0.13% and X at 0.10%, per Socialinsider’s analysis of 70 million posts. These are global figures. YouTube Shorts and Facebook Reels are not broken out as separate formats in that dataset, so any figure claiming a specific Shorts engagement rate against these should be treated carefully.
How much time do Australians spend on short-form video platforms?
Australians spend 1 hour 14 minutes a day on TikTok, 1 hour 12 minutes on YouTube, 1 hour 3 minutes on Instagram and 46 minutes on Facebook, per Meltwater’s Australian data published in 2026. TikTok records the highest daily time of any social platform in Australia.
How much do Australian businesses spend on video advertising?
Australian video advertising reached A$5.4 billion in calendar year 2025, up 19.8% year on year, and accounts for 29% of total online advertising expenditure, per IAB Australia’s report prepared by PwC Australia. Video spend reached A$1.4 billion in the first quarter of 2026, up 20.4%, making it the fastest-growing major segment.
How many Australians use TikTok?
TikTok reaches 10.9 million Australian adults aged 18 and over, or 51.2% of the adult population, and grew 13.9% year on year, per DataReportal’s Australia digital report with data as at October 2025. Lower figures of 8.0 to 8.5 million still circulate widely and come from the previous year’s data.
How did Australia’s under-16 social media ban affect these numbers?
Age-restricted platforms removed access to 4.7 million Australian under-16 accounts by mid-December 2025, after the minimum-age law took effect on 10 December 2025, per the eSafety Commissioner. Every Australian platform figure published with data from October 2025 or earlier, including those on this page, was measured before those removals. Treat them as a ceiling rather than a current audience, particularly for platforms with young skews.
Does short-form video work for business-to-business companies?
Short-form video ranks first for return on investment across all marketers at 49%, but business-to-business teams have moved toward balanced format mixes. In our 2026 State of Creative in Tech report, a survey of more than 230 business-to-business technology marketing leaders, mid-form video now leads for demos, testimonials and product storytelling, with paid social video and customer-proof video tied as the highest-impact formats for 2026.
Why do Australian short-form video statistics vary so much between sources?
Three reasons account for most of the variance. Advertising-platform reach estimates run 30% to 60% above verified user counts and the two get quoted interchangeably. Global and United States figures are frequently presented as Australian. And several widely-repeated numbers, including the 82% internet traffic figure and the 1,200% sharing figure, trace to discontinued forecasts or to no study at all.
Producing Short-Form Video at Volume
The statistics above describe a format that rewards volume and consistency, which is where most teams run into a wall. In our 2026 State of Creative in Tech report, production capacity and internal approvals rank as the top two workflow bottlenecks, and only one team in three has a fully reusable asset system.
We build short-form video systems for business-to-business technology brands. Our short-form video service runs on monthly plans with reusable templates, so each campaign ships faster than the last, and a single production is cut into the platform-specific formats the data above calls for. Teams at Square, Spotify and NinjaOne have used us for conversion-focused campaigns, and NinjaOne’s work generated 66.6 million views and 1.42 million clicks.
If you want to see where your current creative sits before committing to anything, our Creative Intelligence Report is a free competitive analysis covering 12 areas, delivered in 48 hours.
Conclusion
Short-form video in Australia is a A$5.4 billion advertising market growing at nearly 20% a year, watched weekly by 63% of the population, and led by TikTok on daily time and YouTube on total reach. Those are the numbers worth planning against, and each one on this page tells you who published it, when, and which country it describes.
The harder truth is that the Australian data on this topic is thinner than it looks. The most-quoted figure is three years old. There is no published Australian figure for YouTube Shorts. Several numbers that circulate as Australian are neither Australian nor recent. And every audience figure measured before December 2025 now describes a population that changed when 4.7 million under-16 accounts came off these platforms.
At Vidico, we produce short-form and explainer video for business-to-business technology brands, with 2,000+ campaigns and 1.5 billion+ views behind us. If short-form is going into your Australian plan this year, the format question is usually settled and the production question is not. Book a strategy session and we will map what your team can realistically ship.
Sources
- DataReportal: Digital Australia
- IAB Australia: Internet Advertising Expenditure Report
- IAB Australia: Advertising Expenditure Research
- Mediaweek: Instagram Australia Report on Short-Form Video
- Oxford Economics: The Socio-Economic Impact of TikTok in Australia
- eSafety Commissioner: Social Media Age Restrictions
- Meltwater: Social Media Statistics Australia
- Socialinsider: Social Media Benchmarks
- HubSpot: Marketing Statistics
- Search Engine Journal: YouTube Reports 200 Billion Daily Views for Shorts
- AppLogic Networks: Global Internet Phenomena Report
- Forbes: Verizon Media Says 69 Percent of Consumers Watch Video With Sound Off
- Sprout Social: TikTok Statistics Australia