
Private B2B SaaS companies spend a median 8% of annual recurring revenue on marketing alone, according to SaaS Capital’s 2026 survey of more than 1,000 companies. Benchmarkit’s survey of 1,600+ SaaS companies puts the median a little higher at 10% of revenue. Add sales to the picture and the number jumps: sales and marketing combined runs 30% to 50% of revenue for most B2B SaaS companies.
That single median hides a wide spread. A seed-stage startup burning venture money to find product-market fit spends a very different share than a profitable, bootstrapped company at $50M in revenue. Funding model, growth stage, and company size each move the number by double digits.
The biggest source of confusion is also the simplest to fix. “Marketing” and “sales and marketing” are two different lines. Marketing alone sits near 8% to 10% of revenue. Sales and marketing combined sits near 30% to 50%, because it folds in sales salaries and commissions. This page keeps the two separate, and every figure below carries a named source and the year the data describes.
Citation Policy: These benchmarks are free to reference and reuse, including in commercial work such as reports, decks, and articles. If a figure here helps you, a link back to Vidico is all we ask in return.
Key Takeaways
- Median marketing spend is 8% of ARR for private B2B SaaS companies (SaaS Capital, 2026 data).
- Sales and marketing combined run 30% to 50% of revenue, confirmed by public-company filings and industry surveys.
- The median marketing budget is 10% of revenue across 1,600+ SaaS companies (Benchmarkit, 2025 data).
- All-industry marketing budgets sit at 7.8% of revenue among large-company CMOs (Gartner CMO Spend Survey, 2026 data).
- Marketing spend falls with scale, from 14% of revenue under $5M ARR to 4% above $150M ARR (Benchmarkit).
- Equity-backed SaaS spends about twice as much on marketing as bootstrapped SaaS (SaaS Capital).
- Public SaaS companies post a median sales-and-marketing cost of 39% of revenue, and 9 of the 10 largest cut that share in the latest fiscal year (SEC filings).
- Martech’s share of the budget fell to a decade low of 19.4% in 2026 (Gartner CMO Spend Survey).
- CMOs now put 15.3% of the marketing budget into AI (Gartner, 2026 data).
Content
How Much SaaS Companies Spend on Marketing (Headline Benchmarks)
SaaS companies spend a median of 8% to 10% of revenue on marketing alone. The figure moves with which companies each survey measures, not with any real disagreement about the number.
| Survey | Who it measures | Marketing as % of revenue | Data year |
|---|---|---|---|
| SaaS Capital | 1,000+ private B2B SaaS companies | 8% (median) | 2026 |
| Benchmarkit | 1,600+ private B2B SaaS companies | 10% (median) | 2025 |
| Gartner CMO Spend Survey | 400+ CMOs, mostly $1B+ revenue, all industries | 7.8% | 2026 |
| The CMO Survey | 280+ US marketing leaders, all industries | 9.0% | 2026 |
Source: SaaS Capital, Benchmarkit, Gartner CMO Spend Survey, and The CMO Survey.
SaaS Capital and Benchmarkit both measure private B2B SaaS and land at 8% to 10%. Gartner samples much larger companies across every industry, so its 7.8% reflects mature enterprises, not startups. Agency compilations often quote a wider 7% to 15% planning range, but the survey medians are tighter. For how these budgets are shifting, see our guide to SaaS marketing trends.
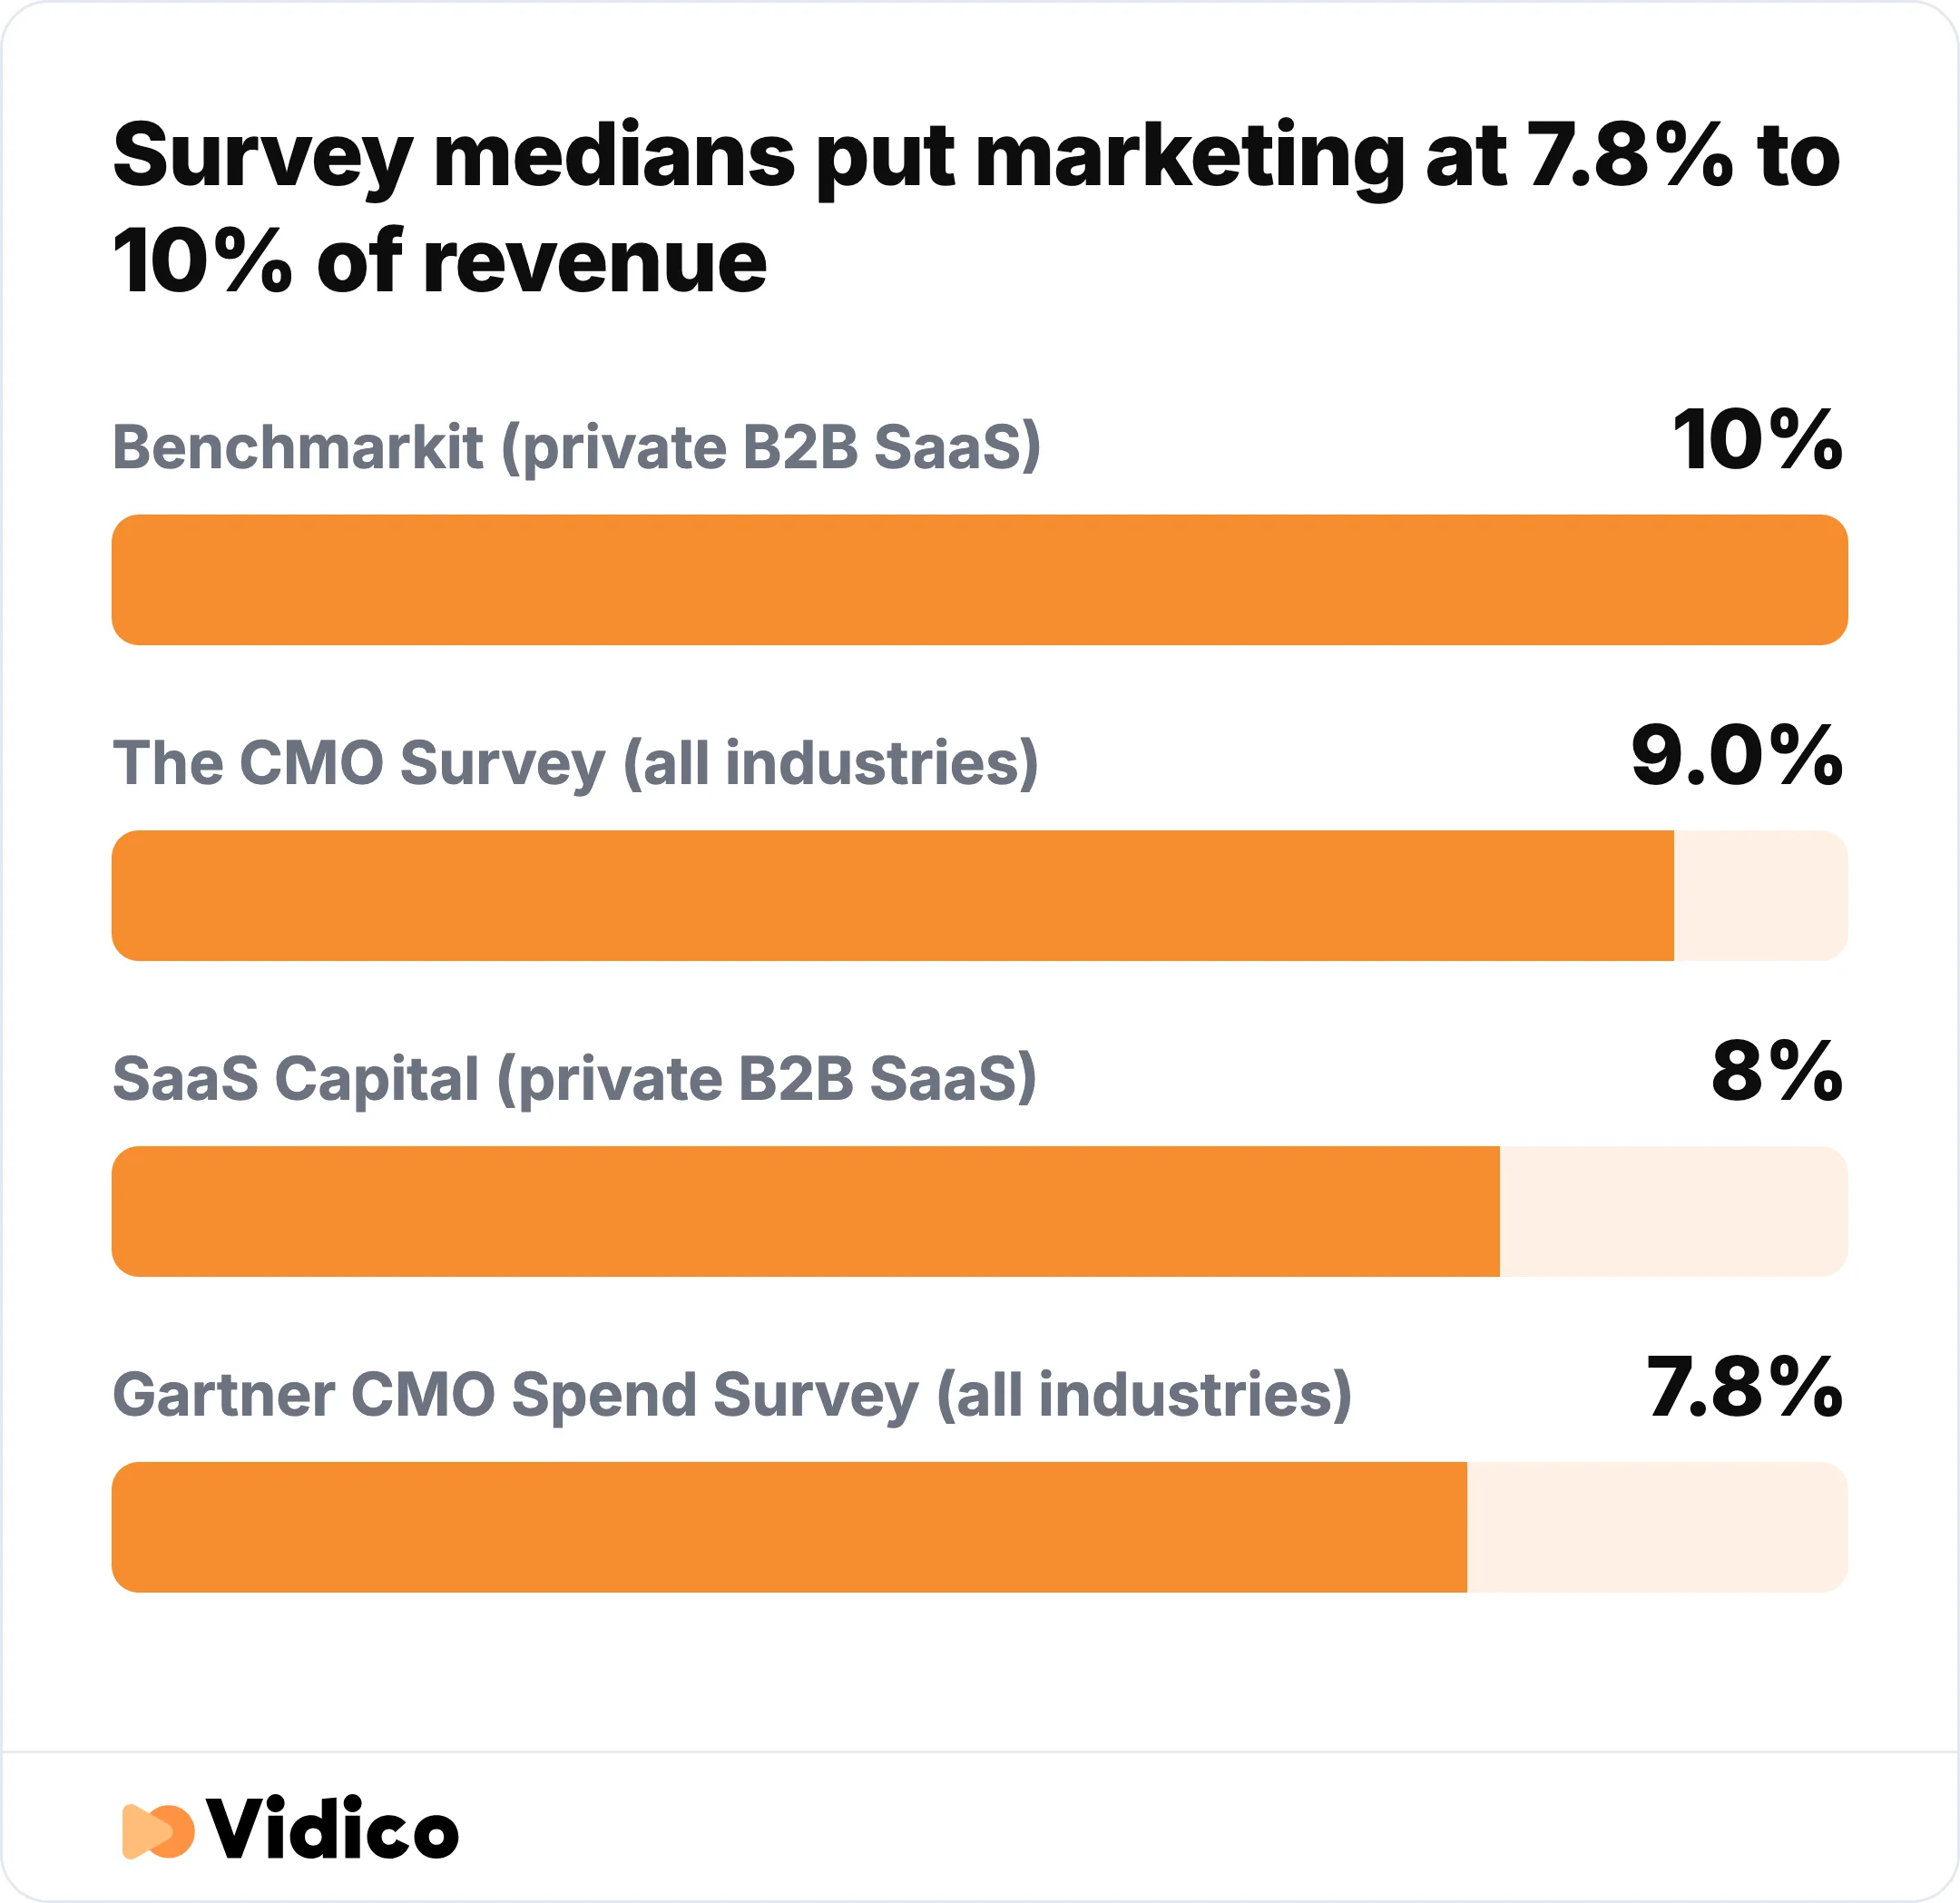
The major surveys put marketing at 7.8% to 10% of revenue, with the two private B2B SaaS surveys at 8% and 10%. Sources: SaaS Capital, Benchmarkit, Gartner CMO Spend Survey, The CMO Survey.
Marketing Spend vs Sales and Marketing Combined
Marketing alone and sales and marketing combined are the two figures people mix up most. Marketing alone sits near 8% to 10% of revenue. The combined figure is higher, but how much higher depends on the company.
| Cost line | Typical % of revenue | What it includes | Source |
|---|---|---|---|
| Marketing alone | 8% to 10% (median) | Demand gen, content, brand, martech, marketing salaries | SaaS Capital / Benchmarkit |
| Selling costs alone | 15% (median, up from 13%) | Sales salaries, commissions, sales tools | SaaS Capital |
| Sales and marketing combined, median private company | ~23% | Marketing plus selling, at the median private SaaS company | SaaS Capital |
| Sales and marketing combined, funded and public companies | 30% to 50% | Both lines, at higher-growth and sales-led firms | Public filings / industry consensus |
Source: SaaS Capital and public-company filings.
For the median private SaaS company, marketing (8%) plus selling (15%) totals about 23% of revenue on sales and marketing, per SaaS Capital. The widely-cited 30% to 50% range describes funded, higher-growth, and public companies that spend far more to chase share, and the public SaaS median lands near 39% of revenue. Marketing is roughly one-third of the combined budget at companies with deal sizes above $10,000, per Benchmarkit. Public SaaS reports only the combined line, so any benchmark drawn from filings describes sales and marketing together, never marketing on its own.
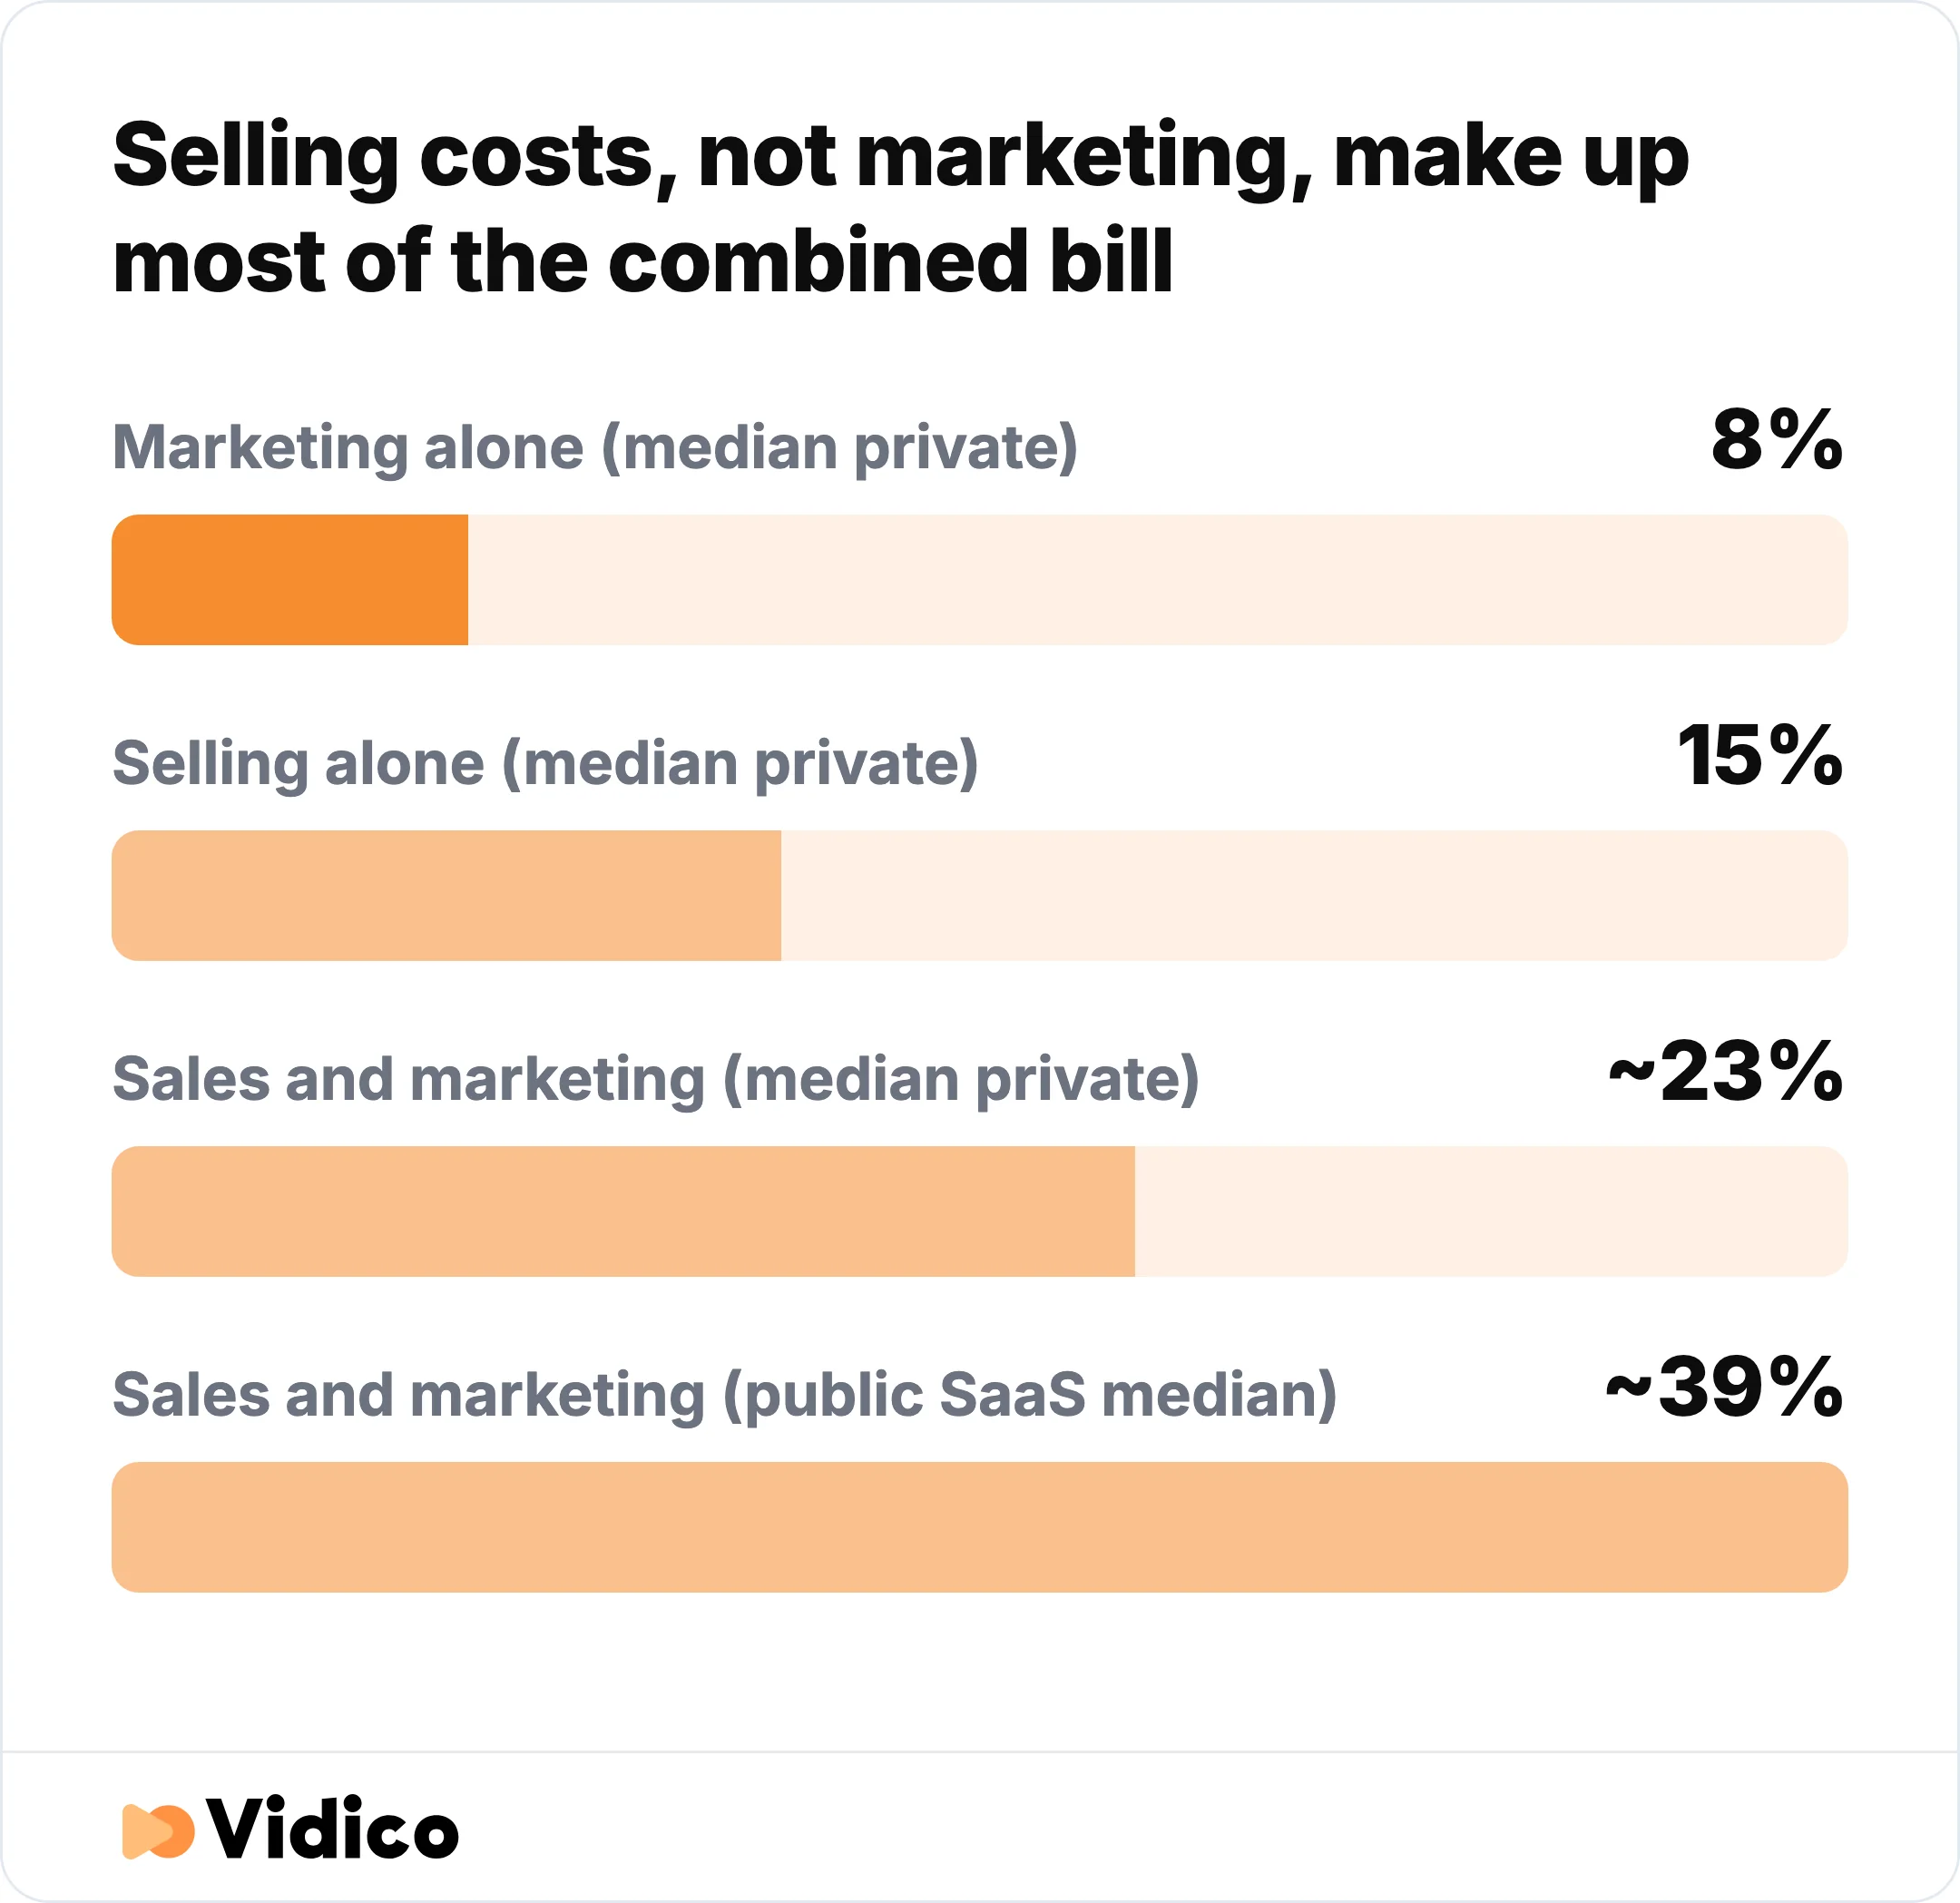
Marketing (8%) plus selling (15%) totals about 23% of revenue at the median private SaaS company, while the public SaaS median lands near 39%. Sources: SaaS Capital, public-company filings.
SaaS Marketing Spend by Company Stage
SaaS spending on sales and marketing is highest early and falls as the company matures. Early-stage companies pay to find channels that work; mature companies shift budget toward retention and expansion.
| Company stage | Typical ARR | Sales and marketing as % of revenue |
|---|---|---|
| Early / pre-scale | Under $1M | 30% to 50% |
| Growth | $1M to $15M | 20% to 40% |
| Mature | $15M+ | 20% to 40% |
| Enterprise | Large, established | 15% to 30% |
Source: Saleo.
Planning heuristics that circulate for marketing alone are far higher than what companies actually spend. Startups are often told to put 25% to 45% of revenue into marketing at the seed stage. Yet the median SaaS company under $5M ARR spends 14% of revenue on marketing, per Benchmarkit. Treat the high startup ranges as rough burn-rate rules of thumb, not survey medians.
SaaS Marketing Spend by ARR Band
Marketing spend as a share of revenue falls steadily as ARR grows. The pattern is one of the most consistent in SaaS: bigger companies spend a smaller percentage, even as their dollar budgets rise.
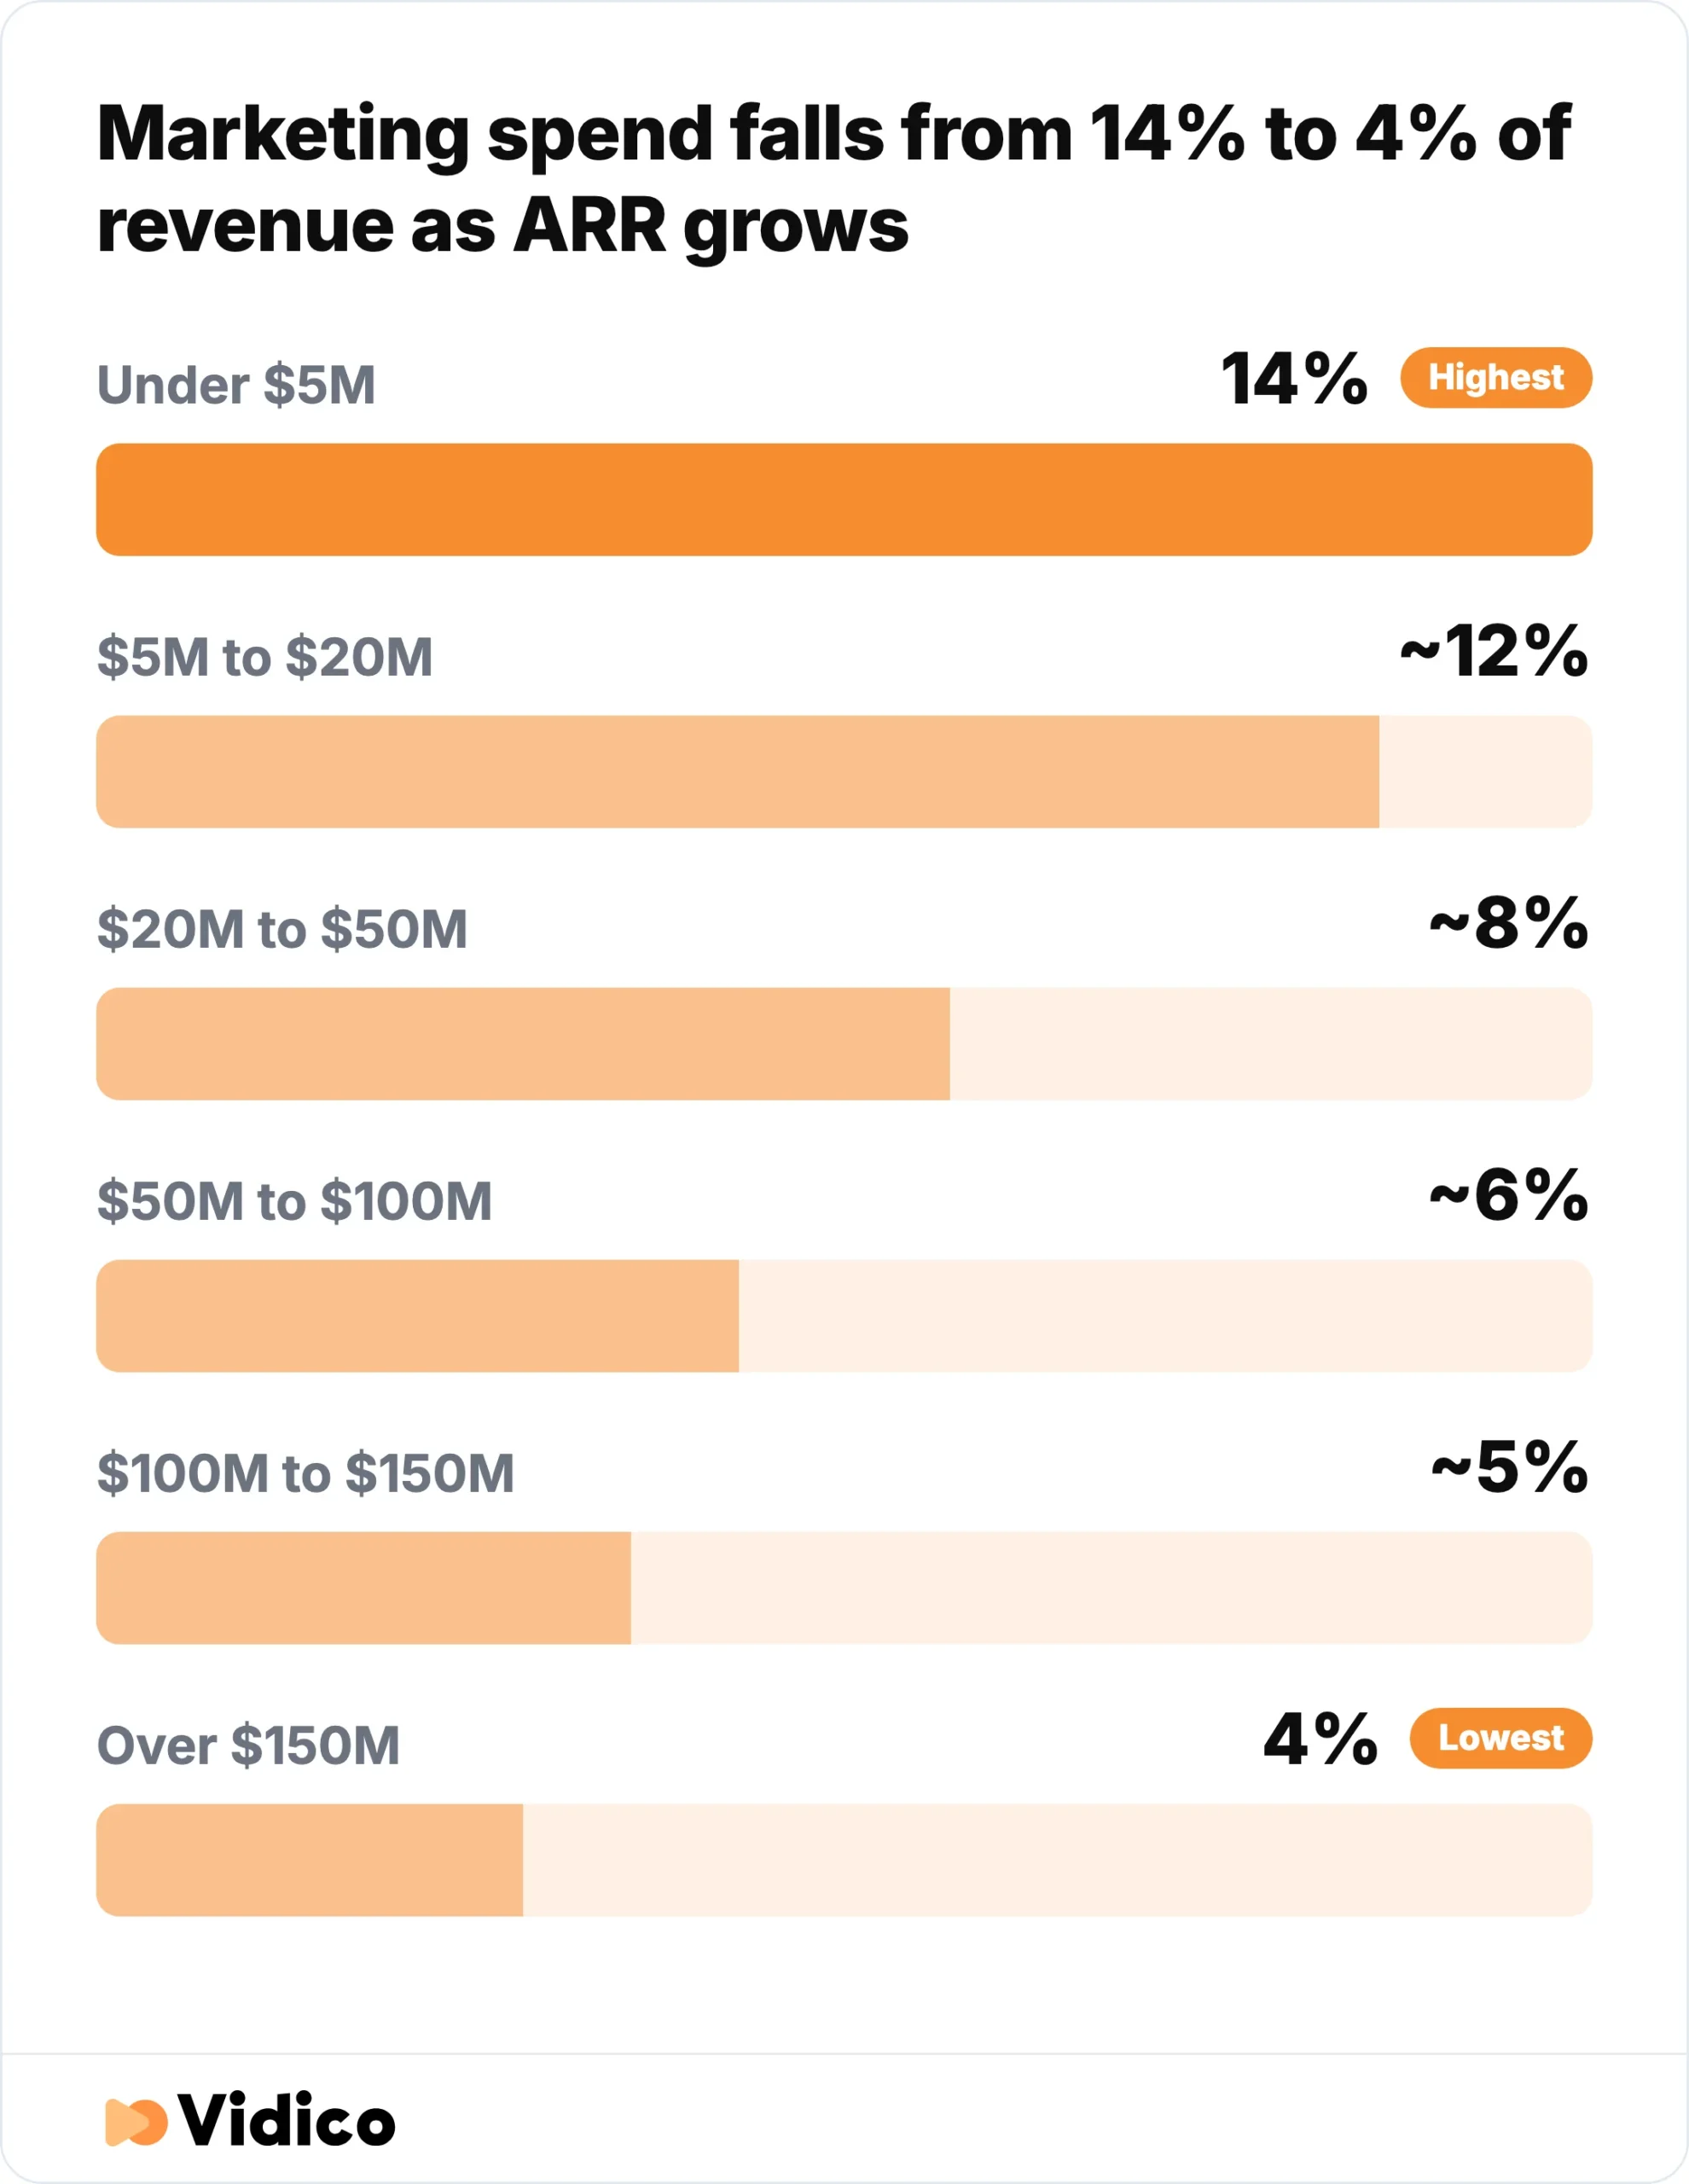
Marketing spend falls from 14% of revenue under $5M ARR to 4% over $150M ARR, even as dollar budgets rise. Source: Benchmarkit.
| ARR band | Marketing as % of revenue |
|---|---|
| Under $5M | 14% |
| $5M to $20M | ~12% |
| $20M to $50M | ~8% |
| $50M to $100M | ~6% |
| $100M to $150M | ~5% |
| Over $150M | 4% |
Source: Benchmarkit.
At $3M to $5M ARR, SaaS Capital reports the full department split as a share of ARR. Marketing is rarely the largest line on the income statement.
| Department | Median spend as % of ARR |
|---|---|
| R&D | 24% |
| General and administrative | 15% |
| Sales | 12% |
| Support | 10% |
| Marketing | 8% |
Source: SaaS Capital.
SaaS Capital’s 8% marketing figure for this slice sits below Benchmarkit’s 14% for companies under $5M because the two surveys define and sample marketing spend differently. Read them together as a range of roughly 8% to 14% of revenue for the smallest SaaS companies.
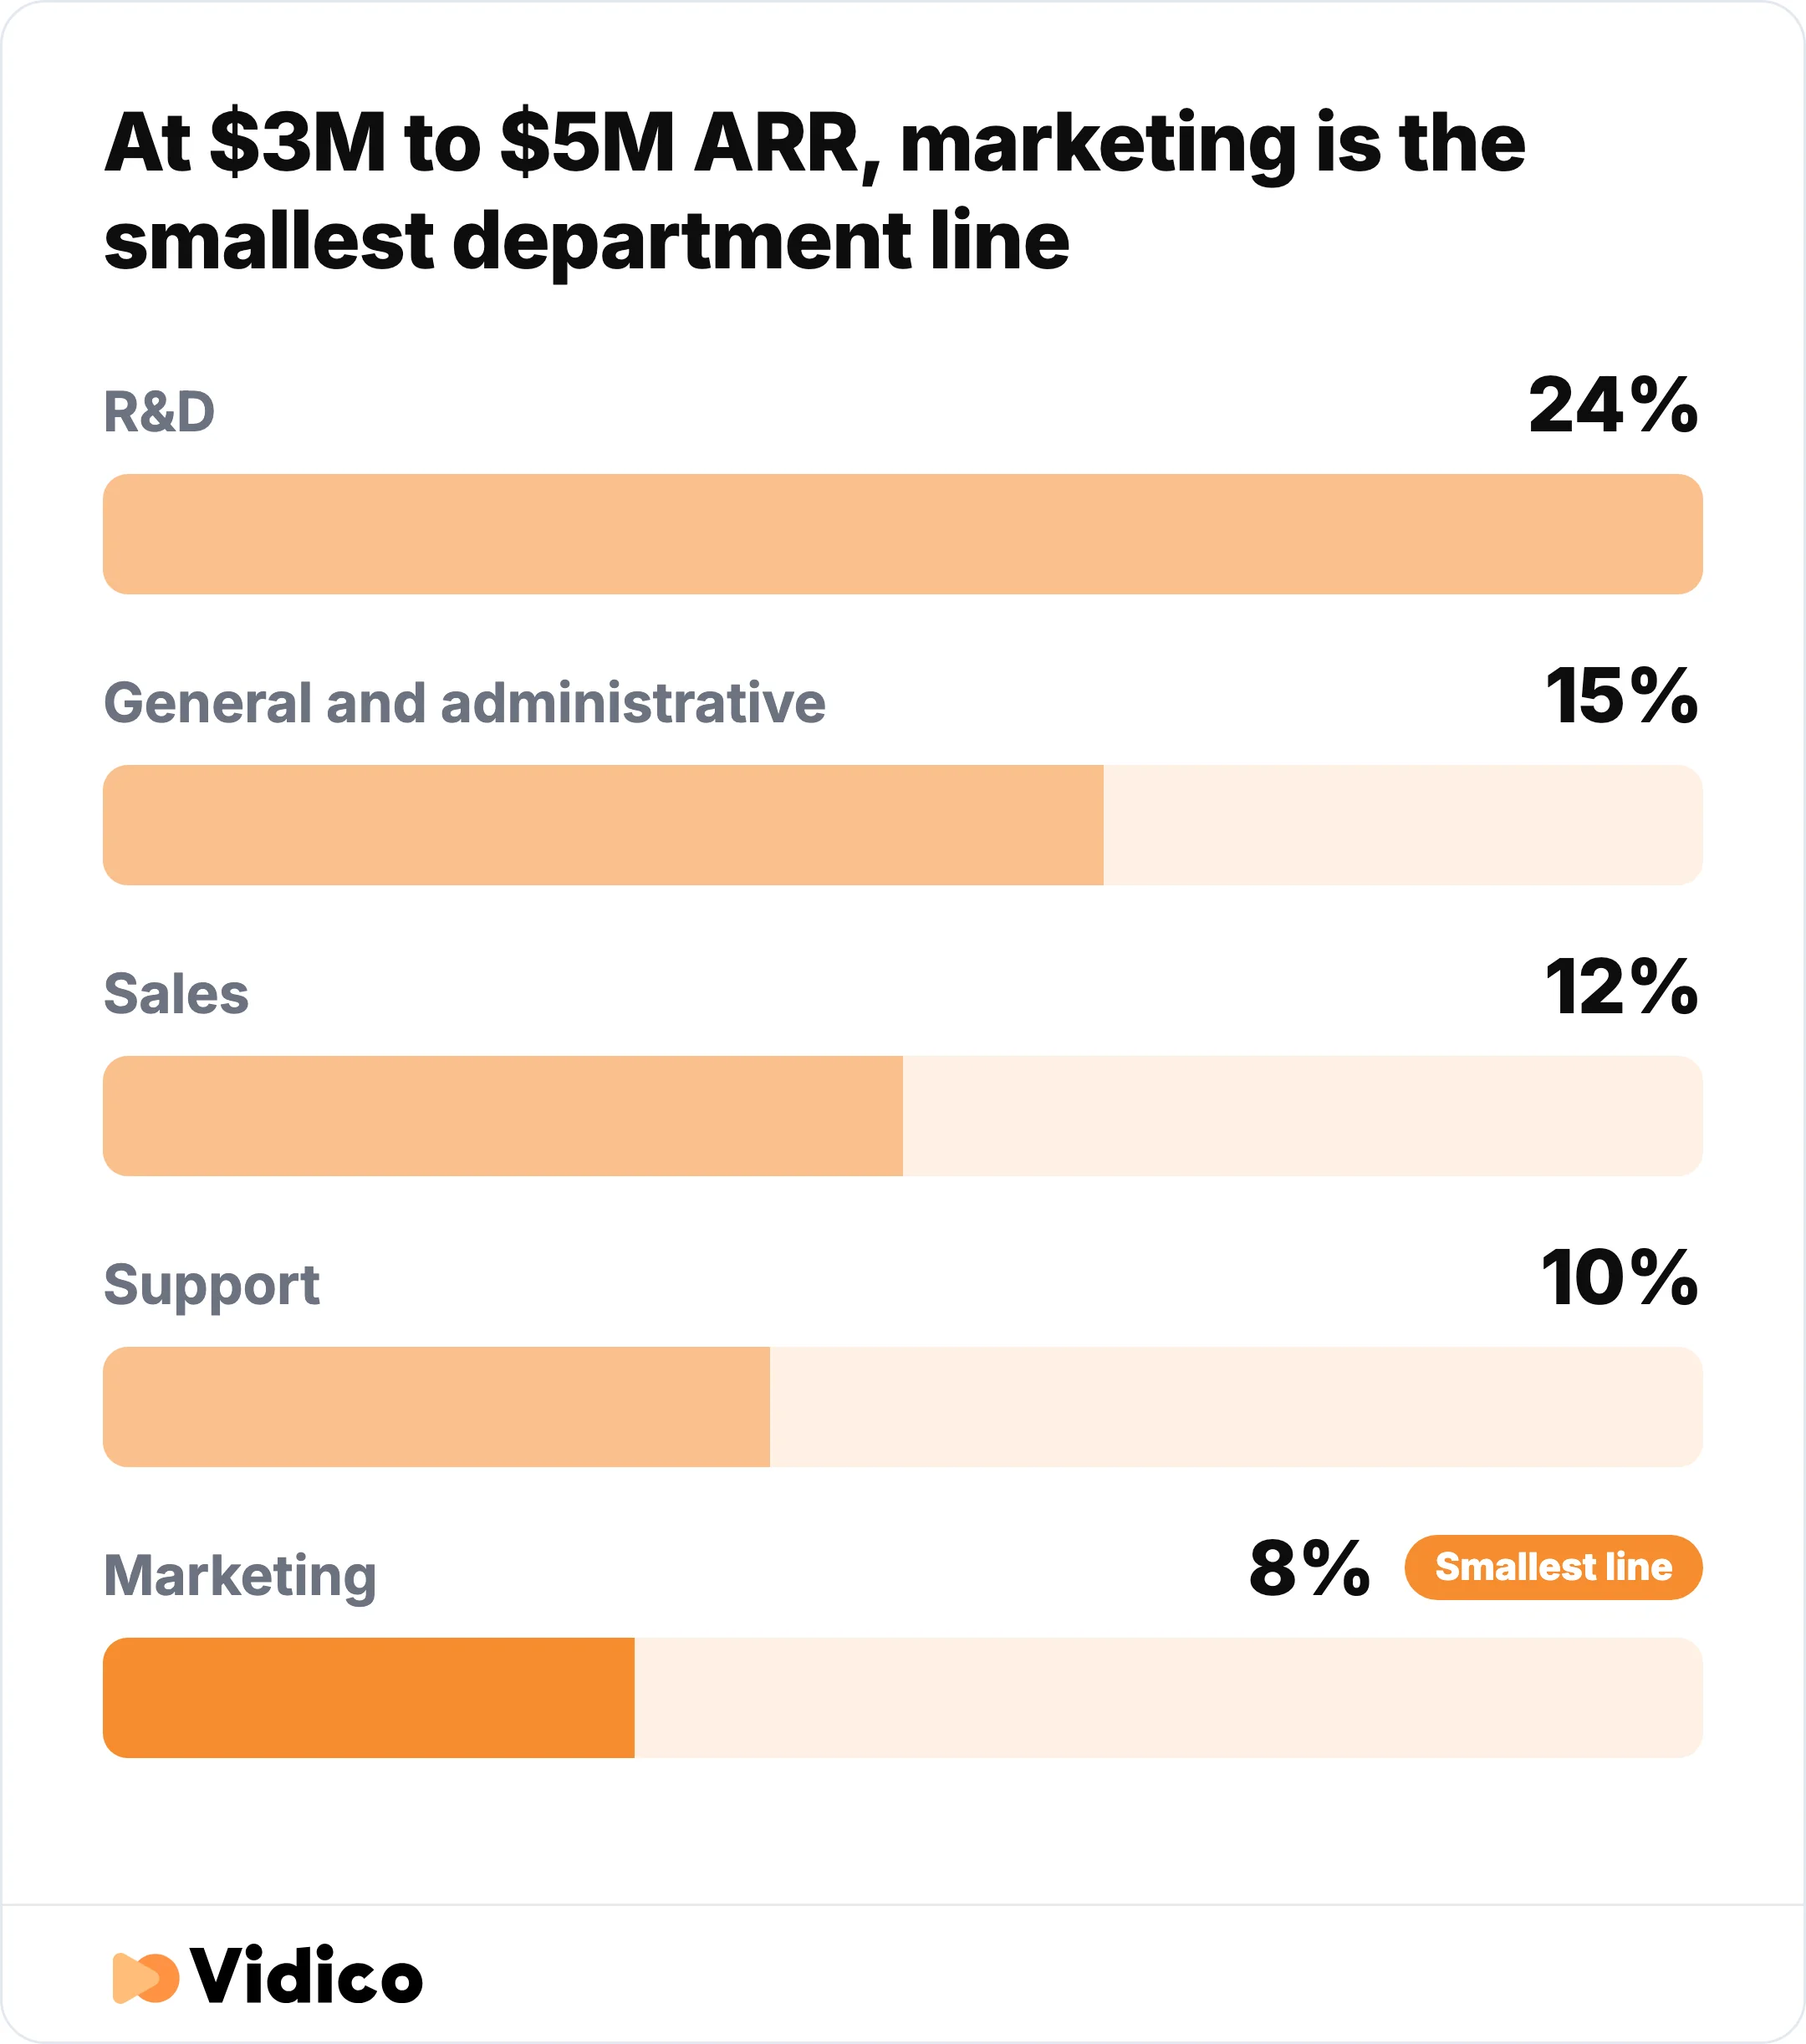
At $3M to $5M ARR, marketing is the smallest department line at 8% of ARR, behind R&D at 24%. Source: SaaS Capital.
Bootstrapped vs Funded: How Funding Changes Spend
Equity-backed SaaS companies spend about twice as much of revenue on marketing as bootstrapped ones. Venture money buys speed, and that speed shows up as a bigger sales-and-marketing bill and thinner profitability.
| Segment | Marketing as % of ARR | Total spend as % of ARR | Share profitable or at breakeven |
|---|---|---|---|
| Bootstrapped | ~6% | 96% | 83% |
| Equity-backed | ~12% | 101% | 52% |
Source: SaaS Capital.
Equity-backed companies spend roughly 100% more on marketing and 70% more on sales than bootstrapped peers, per SaaS Capital. The trade-off is margin: only 52% of equity-backed companies are profitable or at breakeven, against 83% of bootstrapped ones. Ownership keeps shaping spend even at scale. Among companies above $100M ARR, venture-backed firms post a median sales-and-marketing cost of 47% of revenue against 33% for private-equity-backed firms, per Benchmarkit. That is why a venture-backed company at $100M ARR can still spend like a growth-stage business, well above the 15% to 30% typical of mature, efficiency-focused enterprises. Funding, not size alone, sets the pace.
What Public SaaS Companies Spend on Sales and Marketing
Public SaaS companies report a median sales-and-marketing cost near 39% of revenue, and almost all of them are cutting it. These figures come from company income statements, which report sales and marketing as one combined line under GAAP, so none of them isolates marketing on its own.
| Company (ticker) | Sales and marketing as % of revenue (latest FY) | Prior FY | Direction |
|---|---|---|---|
| Atlassian (TEAM) | 23.5% | 21.8% | Up |
| Datadog (DDOG) | 27.9% | 28.2% | Down |
| Zoom (ZM) | 28.5% | 30.6% | Down |
| ZoomInfo (ZI) | 33.2% | 34.1% | Down |
| Salesforce (CRM) | 34.5% | 35.0% | Down |
| Snowflake (SNOW) | 44.0% | 46.1% | Down |
| HubSpot (HUBS) | 44.1% | 46.4% | Down |
| Braze (BRZE) | 44.3% | 47.6% | Down |
| monday.com (MNDY) | 51.2% | 54.9% | Down |
| Asana (ASAN) | 51.5% | 58.0% | Down |
Figures calculated from each company’s own income statement (sales and marketing expense divided by total revenue) in its most recent annual report and fourth-quarter earnings release, filed with the U.S. Securities and Exchange Commission. Each filing is linked in Sources.
Nine of these 10 companies cut their sales-and-marketing share in the latest fiscal year, a clear sign of the efficiency shift across public SaaS. Atlassian is both the lowest and the lone exception. Its self-serve, product-led model keeps sales and marketing near 23% of revenue, roughly half what the sales-led companies on this list spend.
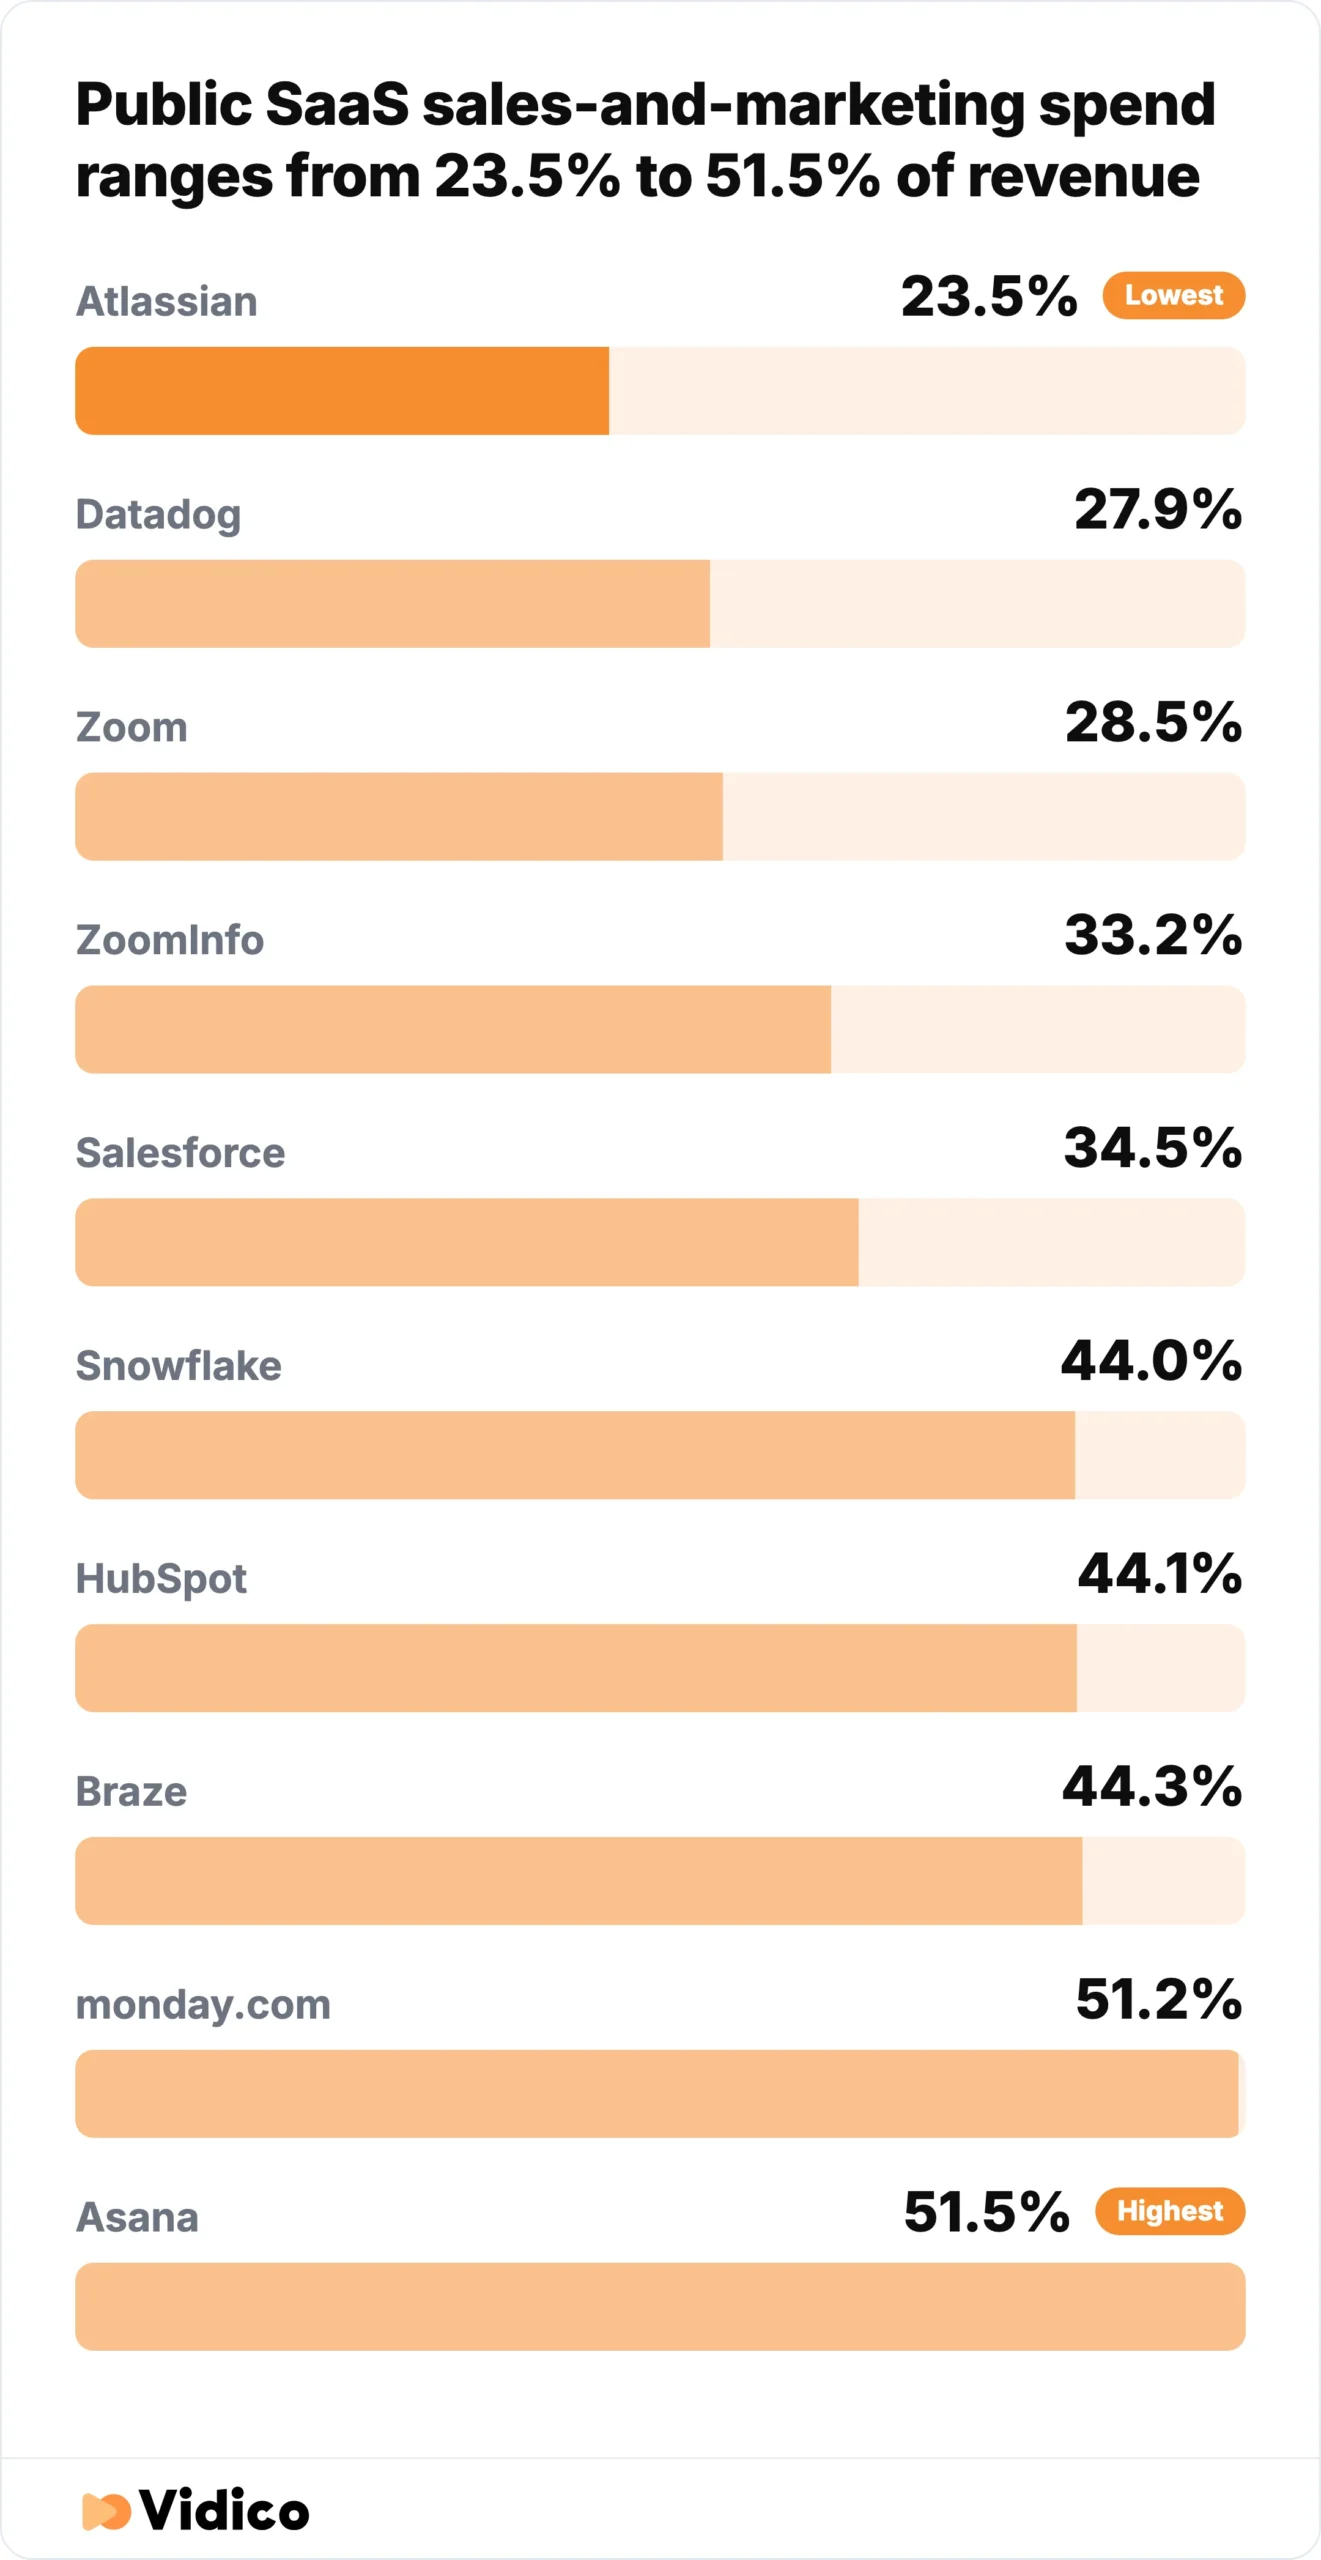
Among 10 public SaaS companies, sales and marketing ranges from 23.5% of revenue at Atlassian to 51.5% at Asana in the latest fiscal year. Source: company income statements filed with the SEC.
SaaS Marketing Spend Over Time (2020-2026)
Marketing budgets spiked after the pandemic, then settled back toward 7% to 8% of revenue. The clearest long-run series comes from Gartner’s annual CMO Spend Survey, which has tracked marketing budget as a share of company revenue across the same instrument for years.
| Year | Marketing budget as % of company revenue |
|---|---|
| 2020 | 11.0% |
| 2021 | 6.4% |
| 2022 | 9.5% |
| 2023 | 9.1% |
| 2024 | 7.7% |
| 2025 | 7.7% |
| 2026 | 7.8% |
Source: Gartner CMO Spend Survey, as reported in each year’s release.
The 2020 reading captured budgets set before the pandemic hit, and 2021 shows the sharp cut that followed. For SaaS specifically, the trend is flatter and higher: SaaS Capital reports marketing at 8% of ARR in 2026, unchanged from 2025. The story of the last three years is stability near the 8% mark, paired with pressure to make each dollar work harder.
Where SaaS Marketing Budgets Actually Go (Spend Allocation)
Most of the marketing budget goes to people and paid media, with martech and outside agencies splitting the rest. Gartner’s 2026 CMO Spend Survey breaks the budget into four large buckets.
| Budget category | Share of marketing budget |
|---|---|
| Paid media | 31.4% |
| Labor and salaries | 24.5% |
| Martech | 19.4% |
| Agencies and other (balance) | ~25% |
Source: Gartner CMO Spend Survey (2026 data). Paid media, labor, and martech are reported figures; agencies and other is the remaining balance.
Inside SaaS, demand generation is the single largest program line. It takes 34% to 38% of the marketing budget at companies between $5M and $100M ARR, dropping to about 29% to 30% above $100M, per Benchmarkit.
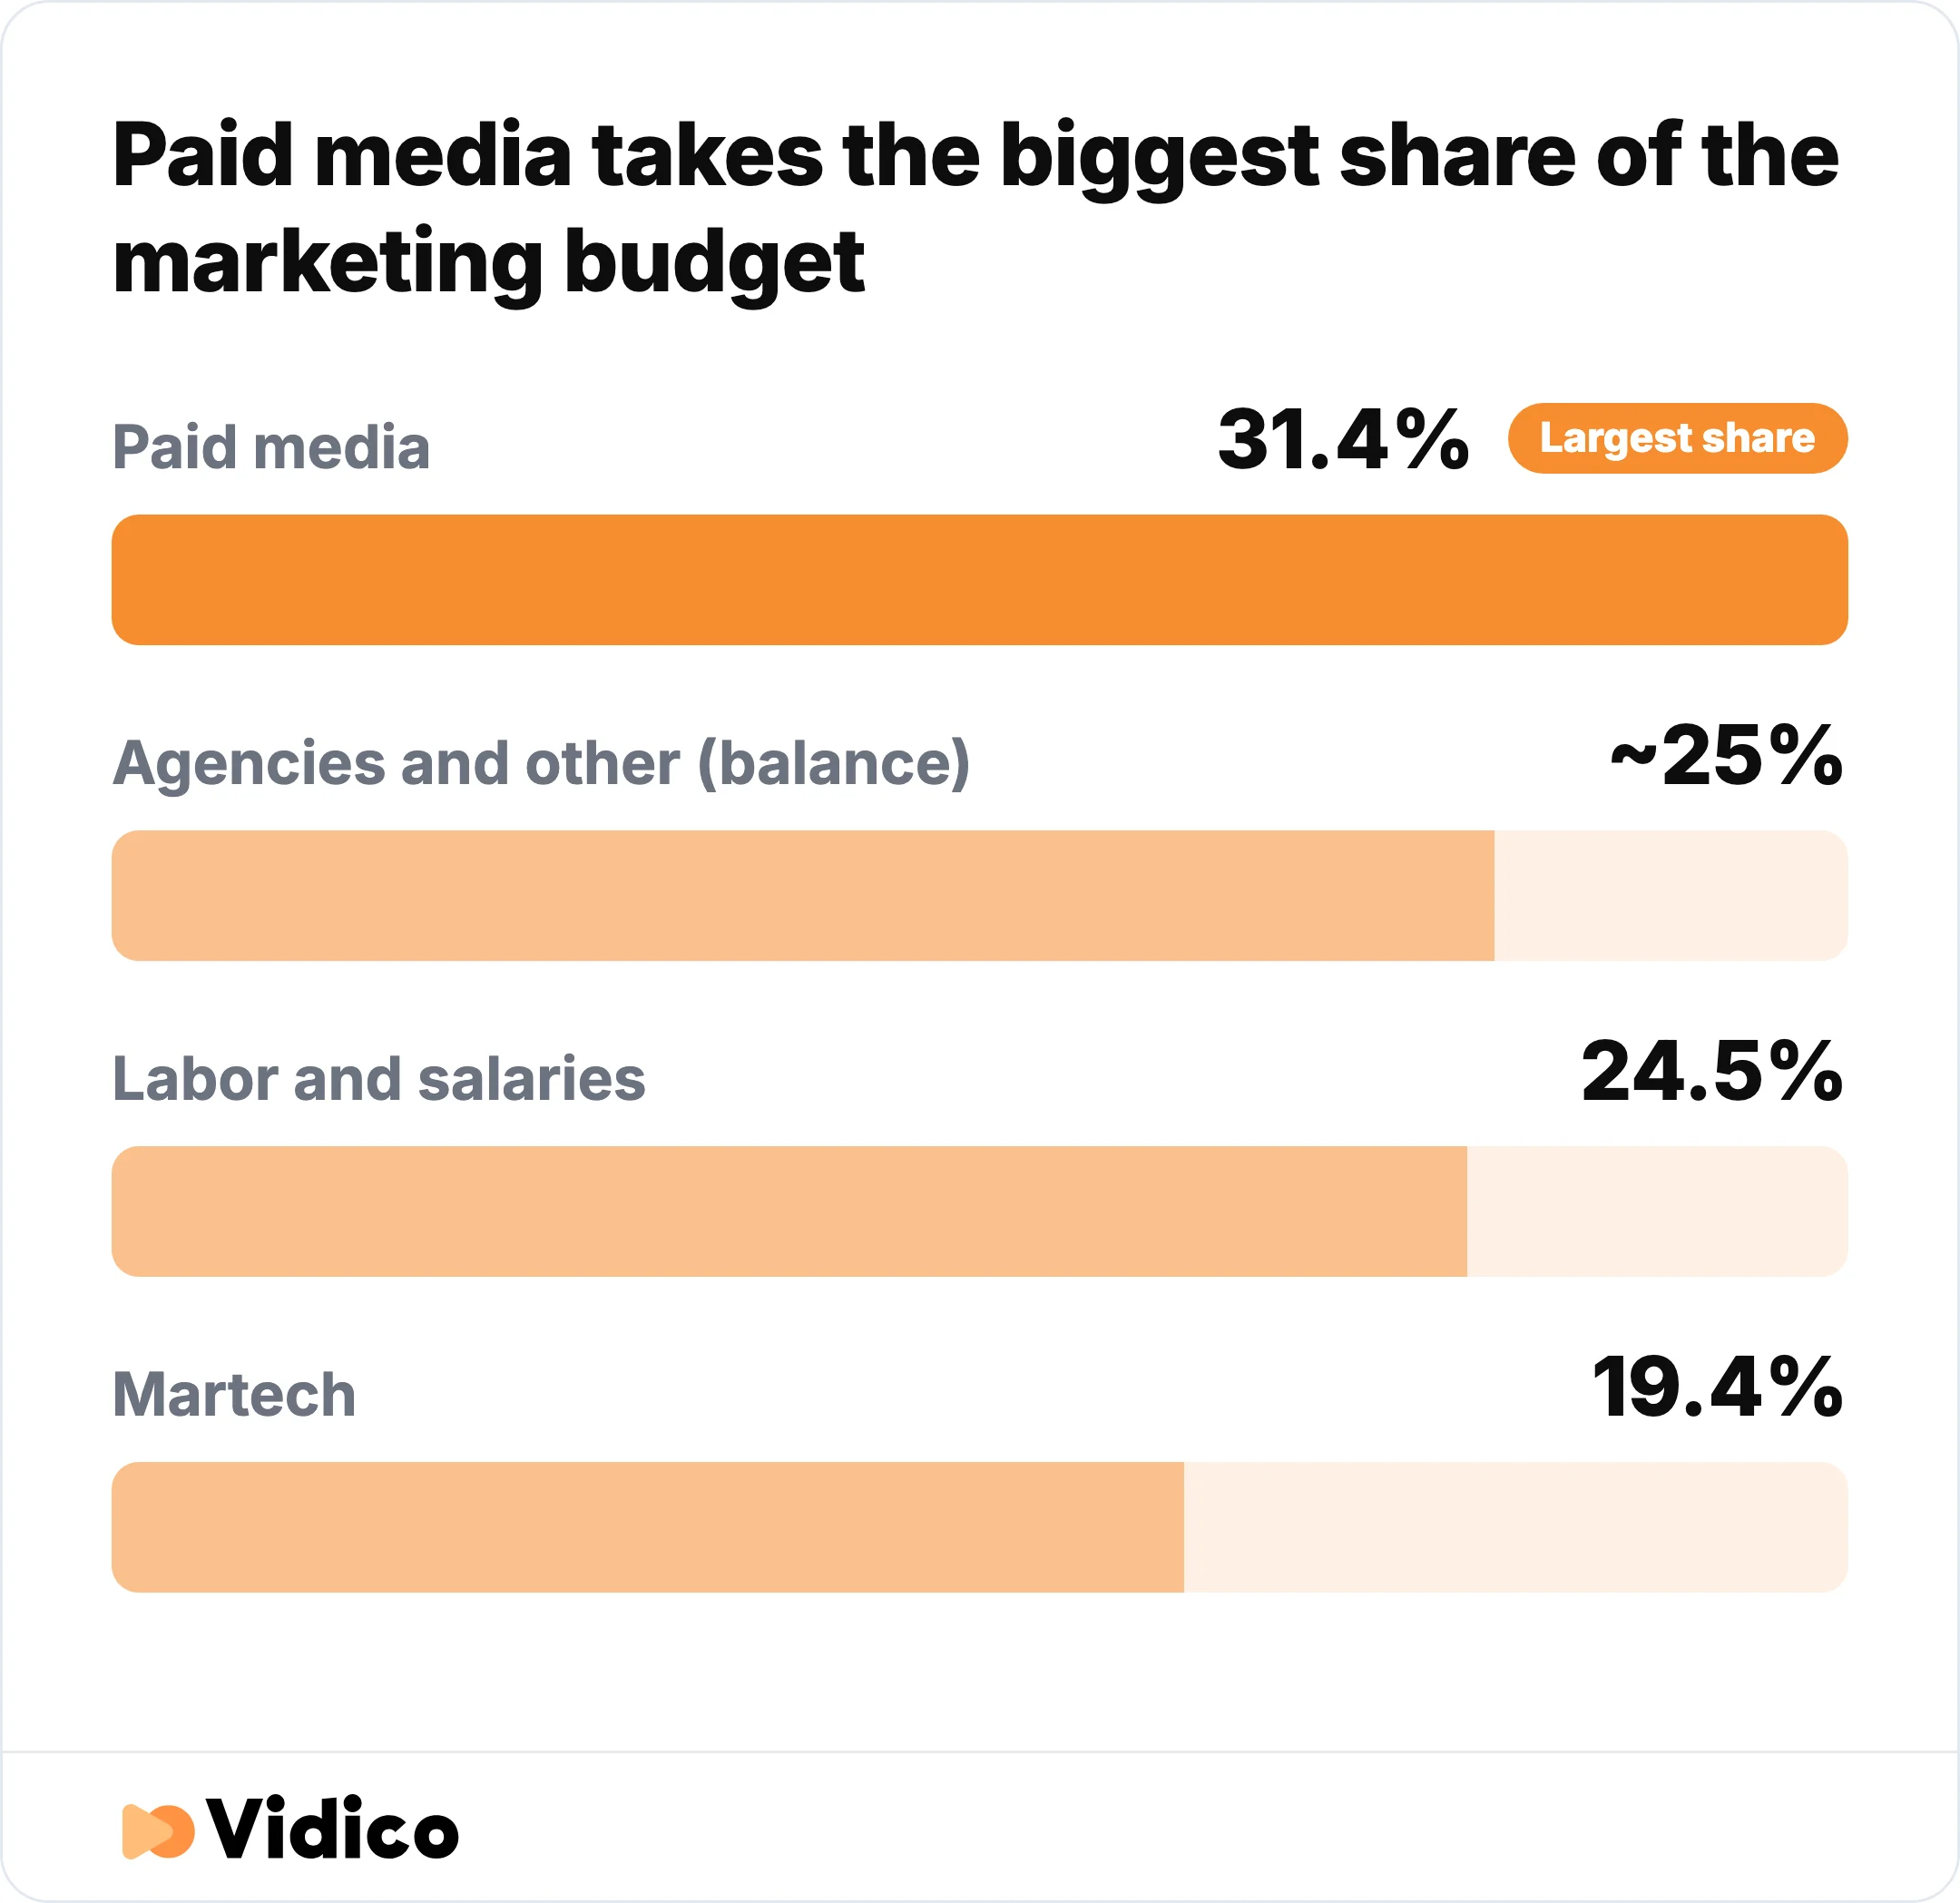
Paid media takes the largest share of the marketing budget at 31.4%, followed by labor at 24.5% and martech at 19.4%, with agencies and other making up the balance. Source: Gartner CMO Spend Survey (2026 data).
How Much Goes to Creative and Content Production?
Creative and content production is a rising share of the SaaS marketing budget. Most B2B tech teams now put 10% to 35% of total marketing spend into creative production, and the trend is upward.
| Share of marketing budget put into creative production | Share of teams |
|---|---|
| 21% to 35% | 42.7% |
| 10% to 20% | 35.9% |
Source: Vidico’s 2026 State of Creative in Tech report, an industry survey of 230+ B2B tech marketing leaders.
In that survey, 76% of B2B tech marketers said their creative production budget is increasing, and when budgets tighten, always-on content is the line teams protect most, with only 9% cutting it first. The full findings are in the ungated State of Creative in Tech report.
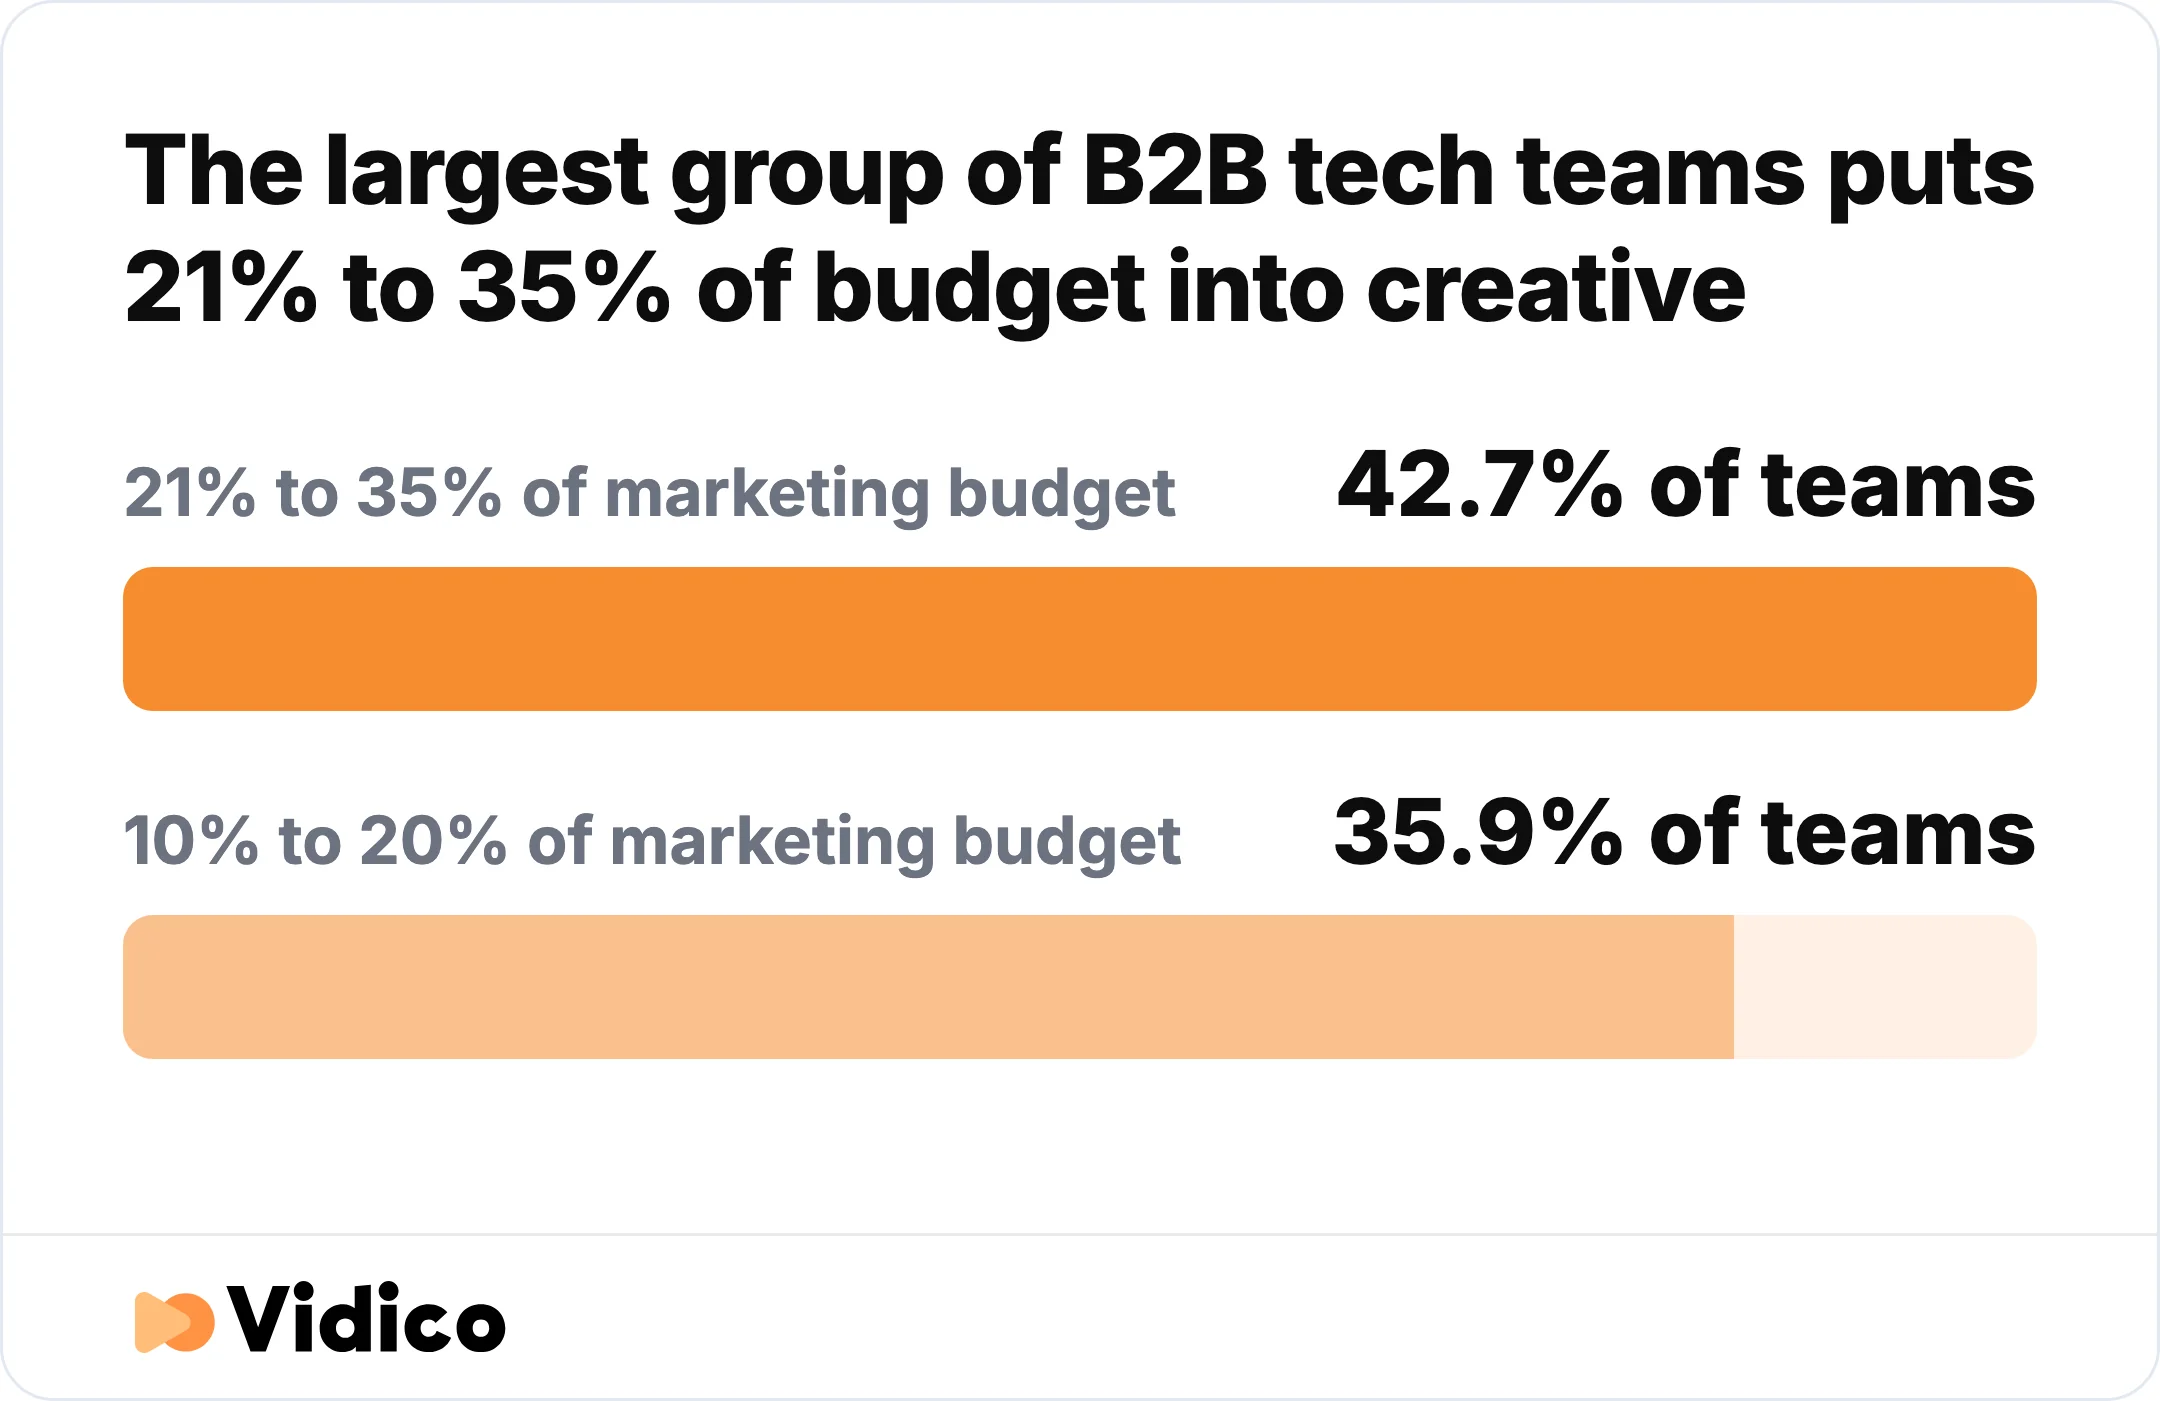
42.7% of B2B tech teams put 21% to 35% of their marketing budget into creative production, and 35.9% put 10% to 20%. Source: Vidico’s 2026 State of Creative in Tech report.
Martech’s Shrinking Share of the Budget
Martech’s share of the marketing budget fell to a decade low of 19.4% in 2026. After years of stack sprawl, CMOs are trimming tools even as they keep buying new ones.
| Year | Martech as % of marketing budget |
|---|---|
| 2021 | 26.6% |
| 2024 | 23.8% |
| 2025 | 22.4% |
| 2026 | 19.4% |
Source: Gartner CMO Spend Survey.
The cut is not for lack of interest. 62% of CMOs still plan to increase martech investment, per Gartner, but utilization is the problem: teams use only about a third of the tools they already pay for.
How Much of the Marketing Budget Now Goes to AI?
CMOs now allocate 15.3% of the marketing budget to AI on average, per Gartner’s 2026 CMO Spend Survey. Among SaaS companies, the share committing real money to AI is climbing fast.
| Share of marketing budget going to AI | Share of SaaS companies (current) | Share two years earlier |
|---|---|---|
| 16% to 20% | 23% | 11% |
| More than 20% | 9% | 4% |
Source: Benchmarkit.
AI is still a small line against people and paid media, but it is the one growing fastest.
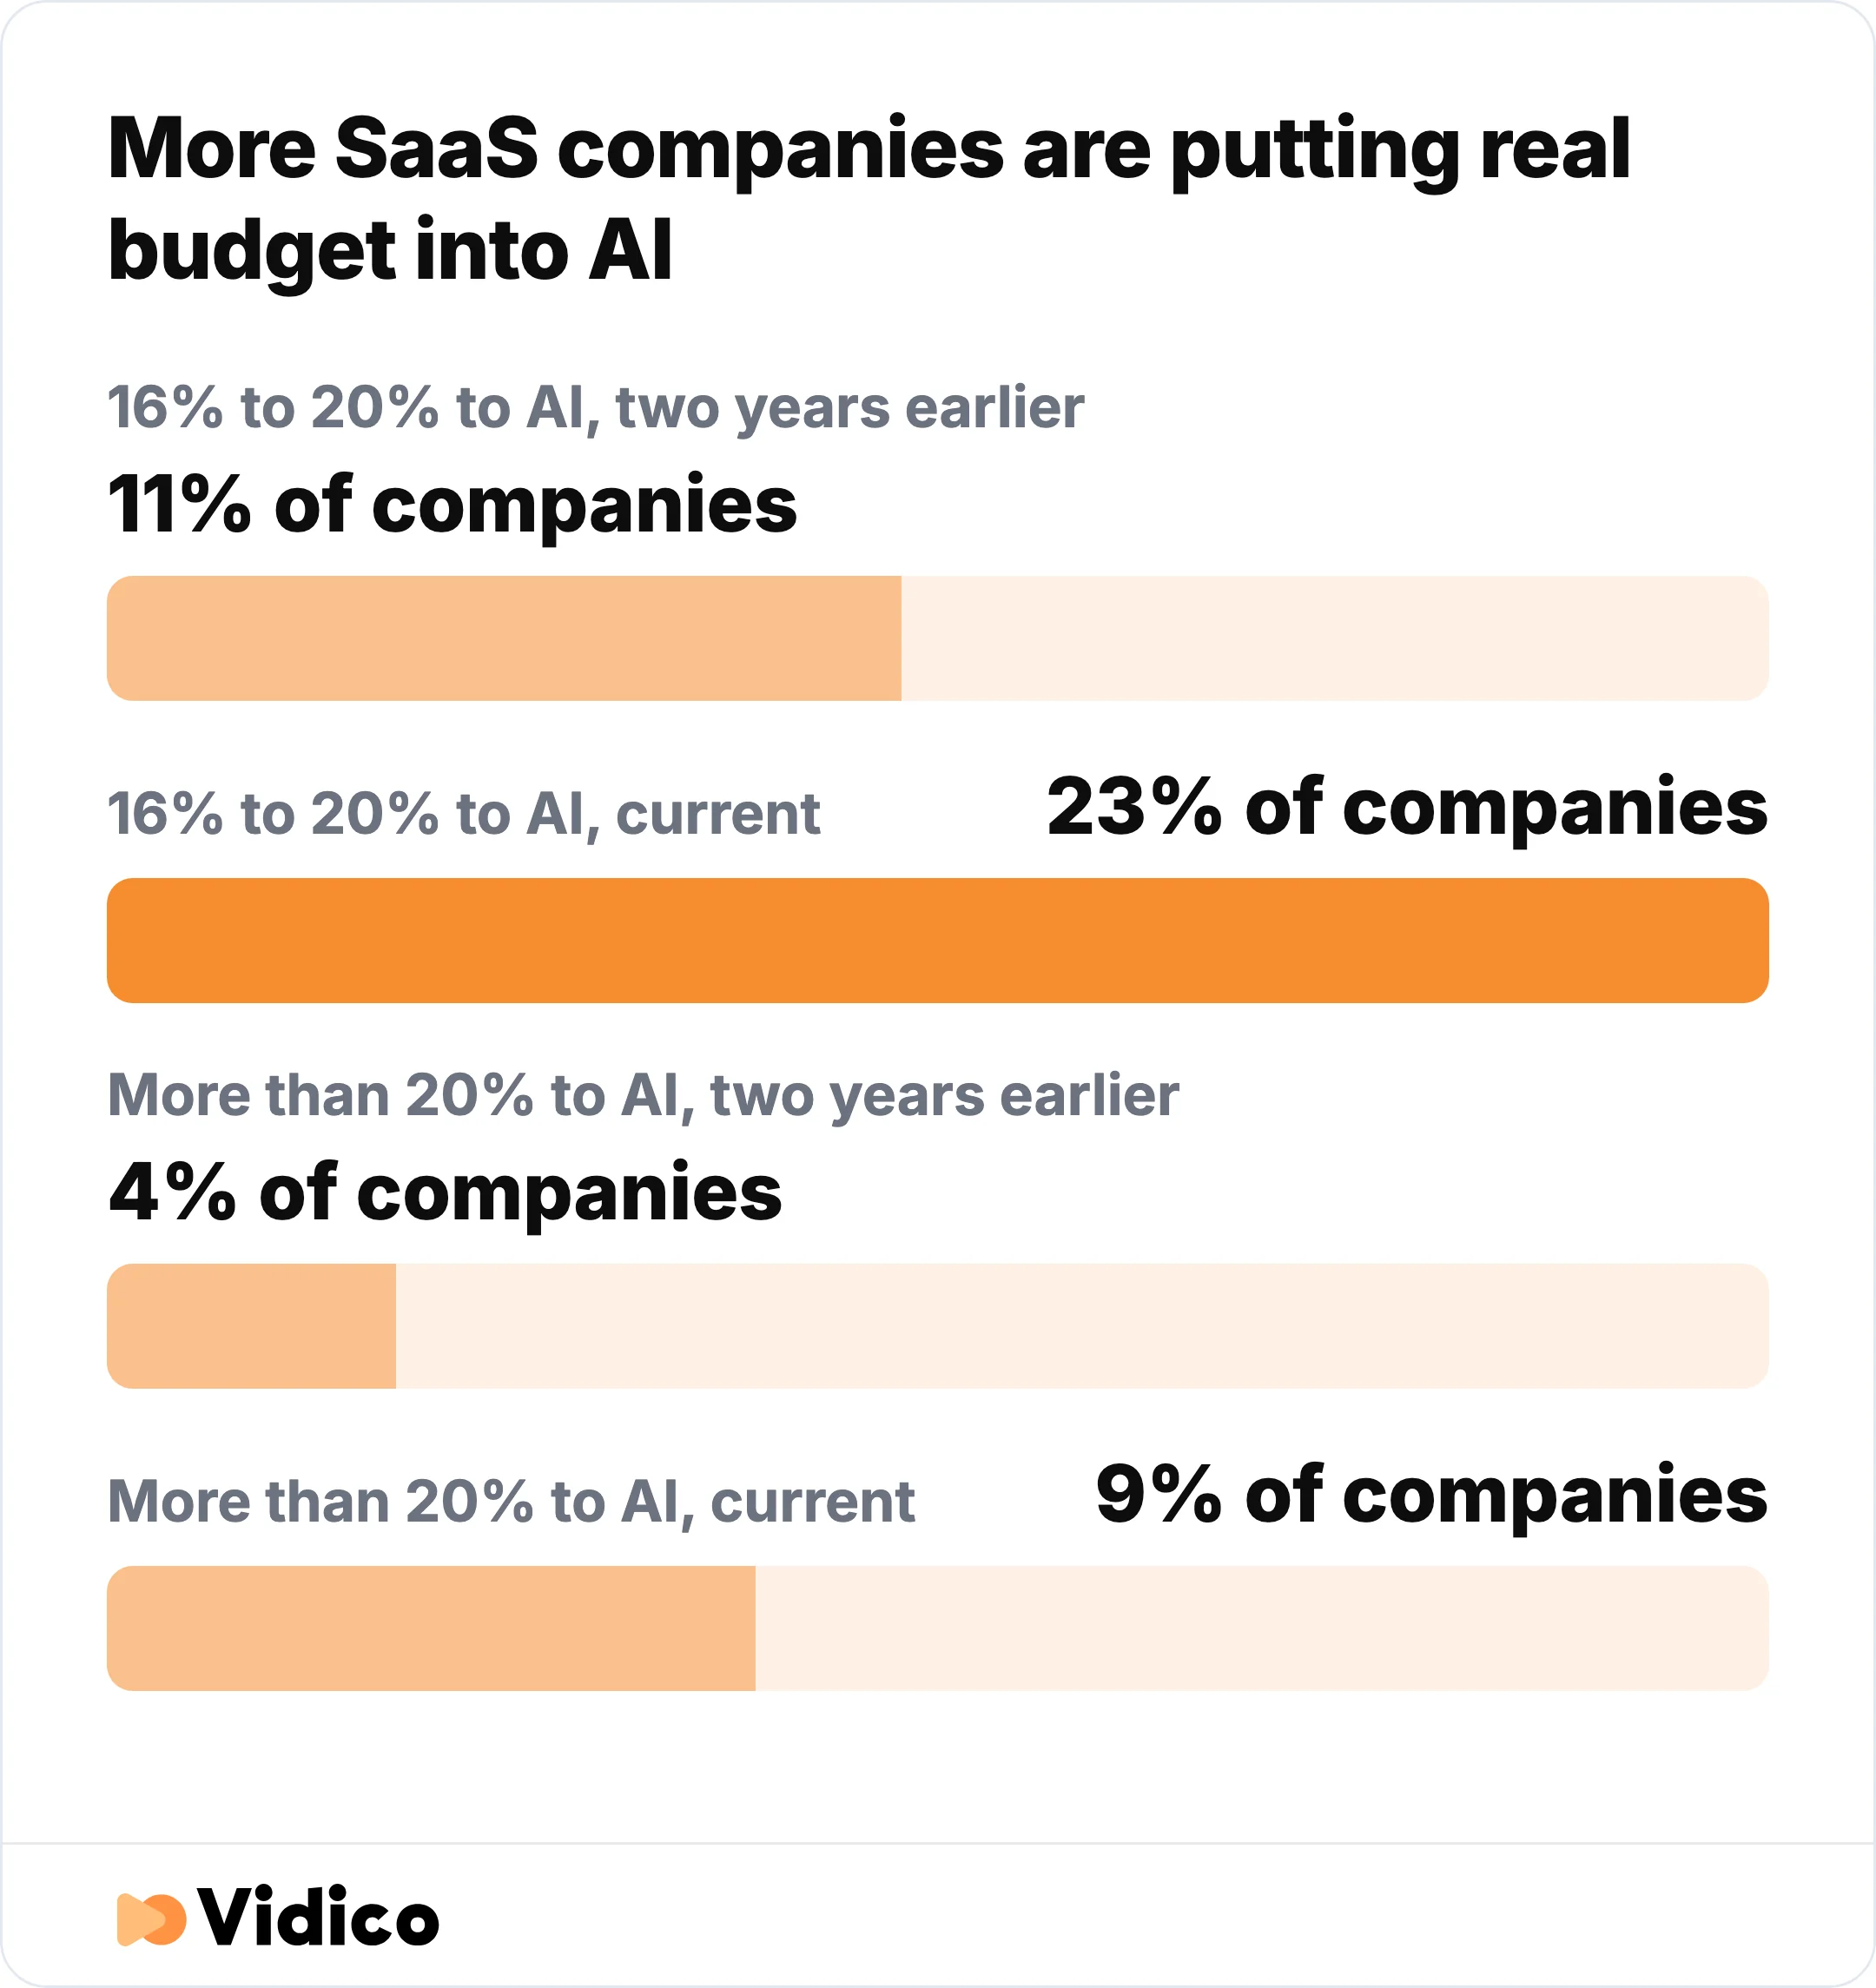
The share of SaaS companies putting 16% to 20% of the marketing budget into AI rose from 11% to 23% in two years, and the share putting in more than 20% rose from 4% to 9%. Source: Benchmarkit.
Customer Acquisition Cost (CAC) Trends
Customer acquisition efficiency improved again after the 2022 spike. Blended acquisition costs fell as companies pulled back on the least efficient spend.
| Metric | Earlier reading | Latest reading | Source |
|---|---|---|---|
| Blended CAC ratio | $1.61 (2023) | $1.40 (2024) | Maxio |
| New-business CAC ratio | $1.76 (2023) | $2.00 (2024) | Maxio |
Source: Maxio Institute.
The blended ratio improving while new-business cost rose tells the real story: expansion and renewal revenue is carrying efficiency, not cheaper new-logo acquisition. Marketing dollars per $1 of new ARR also fall with scale, from $1.03 under $20M ARR to about $0.50 above $50M, per Benchmarkit.
PLG vs Sales-Led: How Go-to-Market Motion Changes Spend
Product-led companies spend more of revenue on marketing, and sales-led companies spend more on sales. The motion decides where the money goes.
| Go-to-market motion | Marketing as % of revenue |
|---|---|
| Product-led (PLG) | 13% |
| Hybrid | 10% |
| Sales-led | 9% |
Source: Benchmarkit.
PLG companies fund the product and self-serve funnel that replaces a sales team, so a larger share lands in marketing. Sales-led companies do the opposite. Even so, sales still drives most pipeline at fast-growing firms: high-growth SaaS companies generate 60% to 80% of new-logo pipeline from sales and 15% to 20% from marketing, per ICONIQ Growth. For where these motions fit, see our SaaS go-to-market strategy guide.
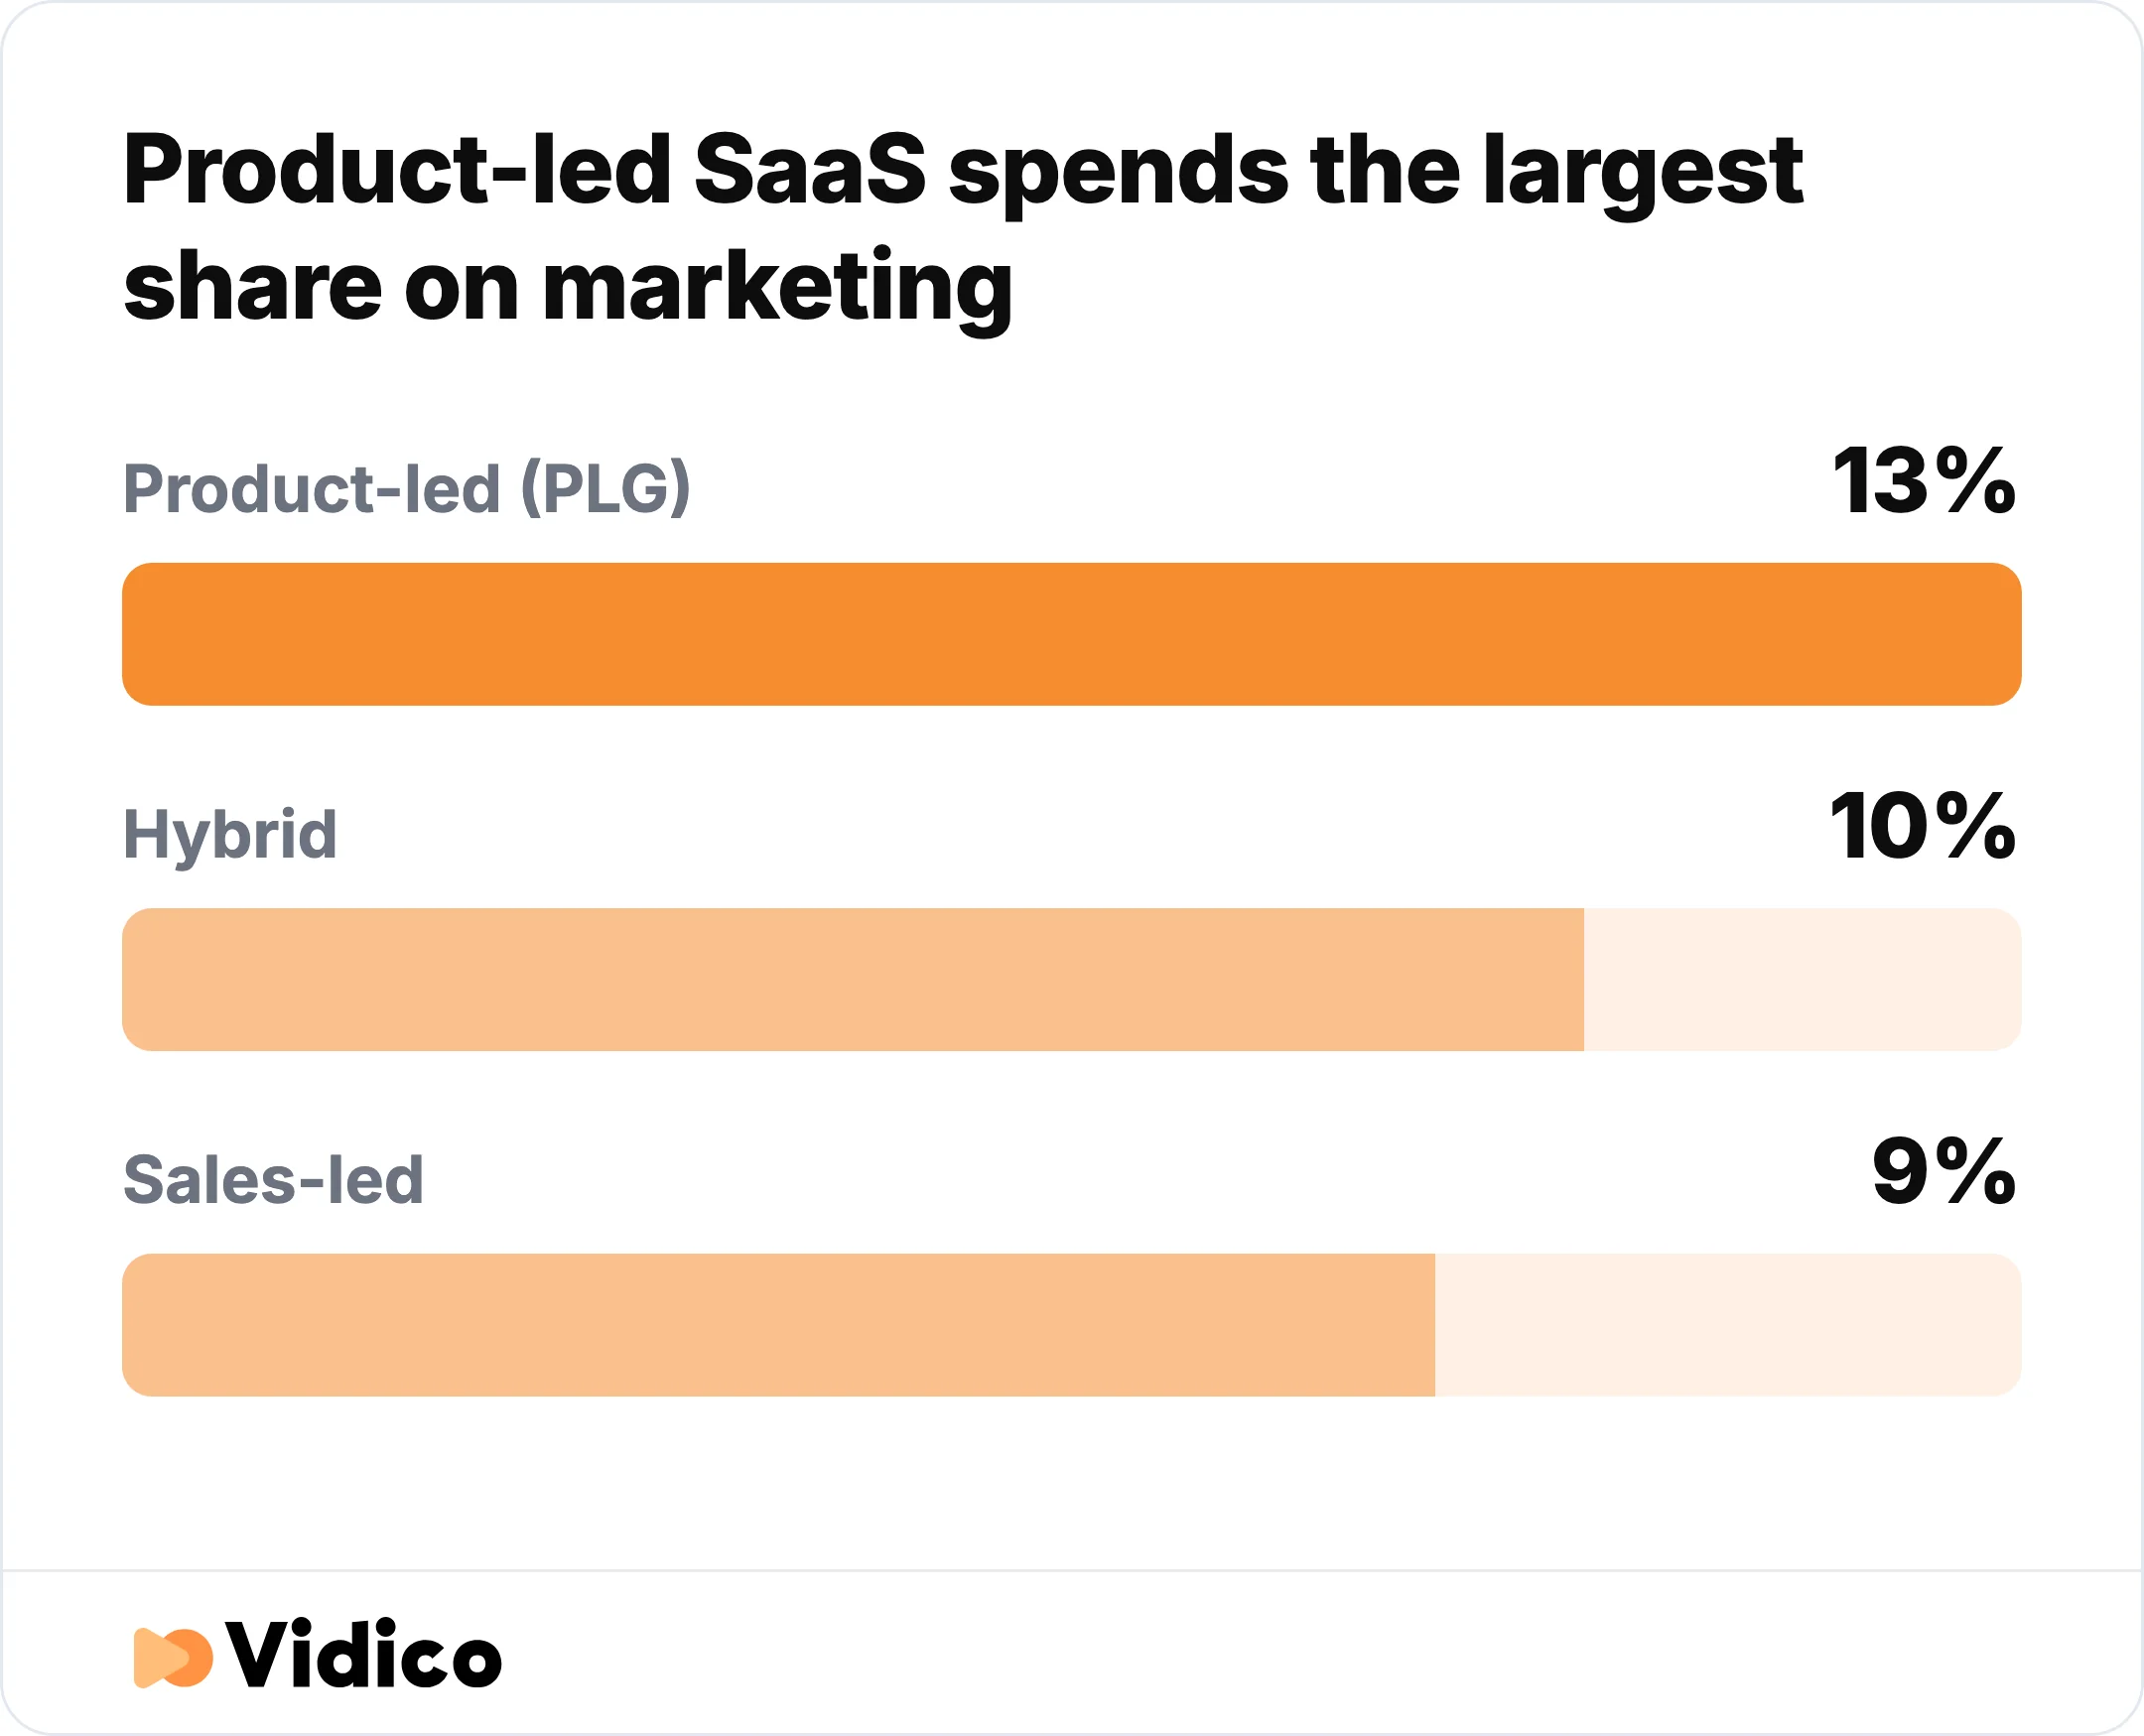
Product-led SaaS companies spend 13% of revenue on marketing, against 10% for hybrid and 9% for sales-led companies. Source: Benchmarkit.
Efficient Growth and the Rule of 40
Spending more only pays off when growth stays efficient, and the Rule of 40 is the common test. The rule holds that a healthy SaaS company’s growth rate plus its profit margin should add up to at least 40.
Few companies clear that bar today. Only 15% of private SaaS companies hit the Rule of 40, down from about a third in 2021, per the KeyBanc and Sapphire Ventures private SaaS survey. Median CAC payback in that survey ran near 23 months. Higher-growth companies do spend more on sales and marketing than slower peers at the same funding level, per SaaS Capital, but the spending only earns its keep when payback and retention hold up.
SaaS Marketing Spend vs Other Industries
SaaS spends a larger share of revenue on marketing than most industries. Software has high gross margins and a land-and-expand model, so it can reinvest more in growth than a manufacturer or a bank.
| Industry | Marketing as % of revenue | Source |
|---|---|---|
| Consumer packaged goods | ~25% | Mercury |
| Professional services | 20% to 21% | Mercury |
| SaaS / software | 15% | Mercury |
| B2B services | 10.1% | The CMO Survey |
| Financial services | 9% to 10% | Mercury |
| B2B product | 7.0% | The CMO Survey |
| Manufacturing | 3% to 4% | Mercury |
Source: Mercury and The CMO Survey.
The SaaS figure moves with the definition. Industry tables that count all of software often show 15%, while surveys that isolate private B2B SaaS medians land nearer the 8% to 10% marketing-alone figure at the top of this page. The direction is consistent even when the exact number is not.
Why the Benchmark Numbers Disagree (The Data Problem)
The benchmarks disagree because the surveys measure different companies and define spend differently. Before citing any single figure, know which companies produced it.
Gartner’s CMO Spend Survey samples large enterprises, mostly above $1B in revenue, so its 7.8% reflects mature companies. The CMO Survey samples smaller US firms and lands at 9%. SaaS Capital and Benchmarkit measure private B2B SaaS and land at 8% to 10%. None is wrong; they count different populations. SaaS Capital is now in its 15th annual edition, which is why its series tracks cleanly year over year.
Source availability also shifts. OpenView’s widely cited SaaS Benchmarks report ran for eight editions from 2017 to 2024. When OpenView wound down in 2024, High Alpha took over the report, so the series continued rather than disappearing. The lesson for anyone quoting a SaaS spending stat is simple: name the survey, name the year, and name who it measured.
Frequently Asked Questions
What is the 70/20/10 rule for marketing budget?
The 70/20/10 rule splits the marketing budget by risk: 70% to proven channels, 20% to promising new ones, and 10% to experiments. It is a planning guideline for balancing reliable performance against testing, not a spending benchmark tied to revenue.
How much should a company spend on marketing?
Most companies spend 7% to 10% of revenue on marketing, per Gartner and The CMO Survey. SaaS and other high-growth categories often run higher, and early-stage companies chasing growth spend more still. The right figure depends on stage, funding, and margins, not a single rule.
What is the 3-3-2-2-2 rule of SaaS?
The 3-3-2-2-2 rule describes an ideal growth path where a SaaS company triples revenue for two years, then doubles it for three years. It is a growth-rate heuristic popularized in venture circles, not a marketing-spend rule, though hitting it usually requires heavy sales-and-marketing investment.
How much do SaaS startups spend on marketing per month?
Early-stage SaaS startups commonly spend in the low tens of thousands per month on marketing, scaling with revenue. A Series A company at $1M to $3M ARR is often cited as spending $15,000 to $50,000 a month, a planning range circulated across SaaS marketing guides rather than a figure from a named survey, and bootstrapped startups spend far less by leaning on content, SEO, and community. Treat monthly figures as a function of ARR and funding, not a fixed number.
The Bottom Line
SaaS companies spend a median of 8% to 10% of revenue on marketing alone, and 30% to 50% on sales and marketing combined. The figure climbs for venture-backed and early-stage companies and falls as ARR grows, and across public SaaS the clear trend is toward efficiency, with nine of the ten largest firms trimming their sales-and-marketing share in the latest year.
At Vidico, we build reusable video and creative production systems for B2B SaaS and tech marketing teams, and we have shipped 2,000+ campaigns and more than 1.5 billion views for brands including Square, Spotify, and NinjaOne. That work sits inside the always-on content line this budget data shows teams protecting first, turning one shoot into 40+ assets so each marketing dollar stretches further.
Creative production is the always-on line teams protect first, and the share of the budget it takes keeps rising. Our 2026 State of Creative in Tech report breaks down how 230+ B2B tech marketing leaders are planning that spend.
Sources:
- SaaS Capital: Spending Benchmarks for Private B2B SaaS Companies
- Benchmarkit: B2B Marketing Benchmarks
- Gartner: CMO Spend Survey
- The CMO Survey
- KeyBanc Capital Markets and Sapphire Ventures: Private SaaS Company Survey
- ICONIQ Growth: State of Go-to-Market
- Maxio Institute: B2B Growth Report
- High Alpha: Stewarding the Future of OpenView’s SaaS Benchmarks
- Saleo: Sales and Marketing as a Percentage of Revenue
- Mercury: How Much Should a Small Business Spend on Marketing?
- Salesforce: Fourth-Quarter Earnings Release
- HubSpot: Full-Year Earnings Release
- Zoom: Fourth-Quarter and Full-Year Financial Results
- Datadog: Fourth-Quarter Results (SEC 8-K)
- monday.com: Fourth-Quarter and Full-Year Results
- Asana: Fourth-Quarter Results (SEC 8-K)
- Braze: Full-Year and Fourth-Quarter Results
- Snowflake: Fourth-Quarter Results (SEC 8-K)
- Atlassian: Fourth-Quarter Earnings Release
- ZoomInfo: Fourth-Quarter Results (SEC 8-K)