Marketing budgets averaged 7.7% of company revenue across 2024 and 2025 before ticking up to 7.8% in 2026, according to Gartner’s annual CMO Spend Survey. That sounds stable until you see the other side: 56% of CMOs say they still lack sufficient budget to deliver their strategy.
The gap between what teams have and what they need makes allocation the real problem. Not how much to spend, but where.
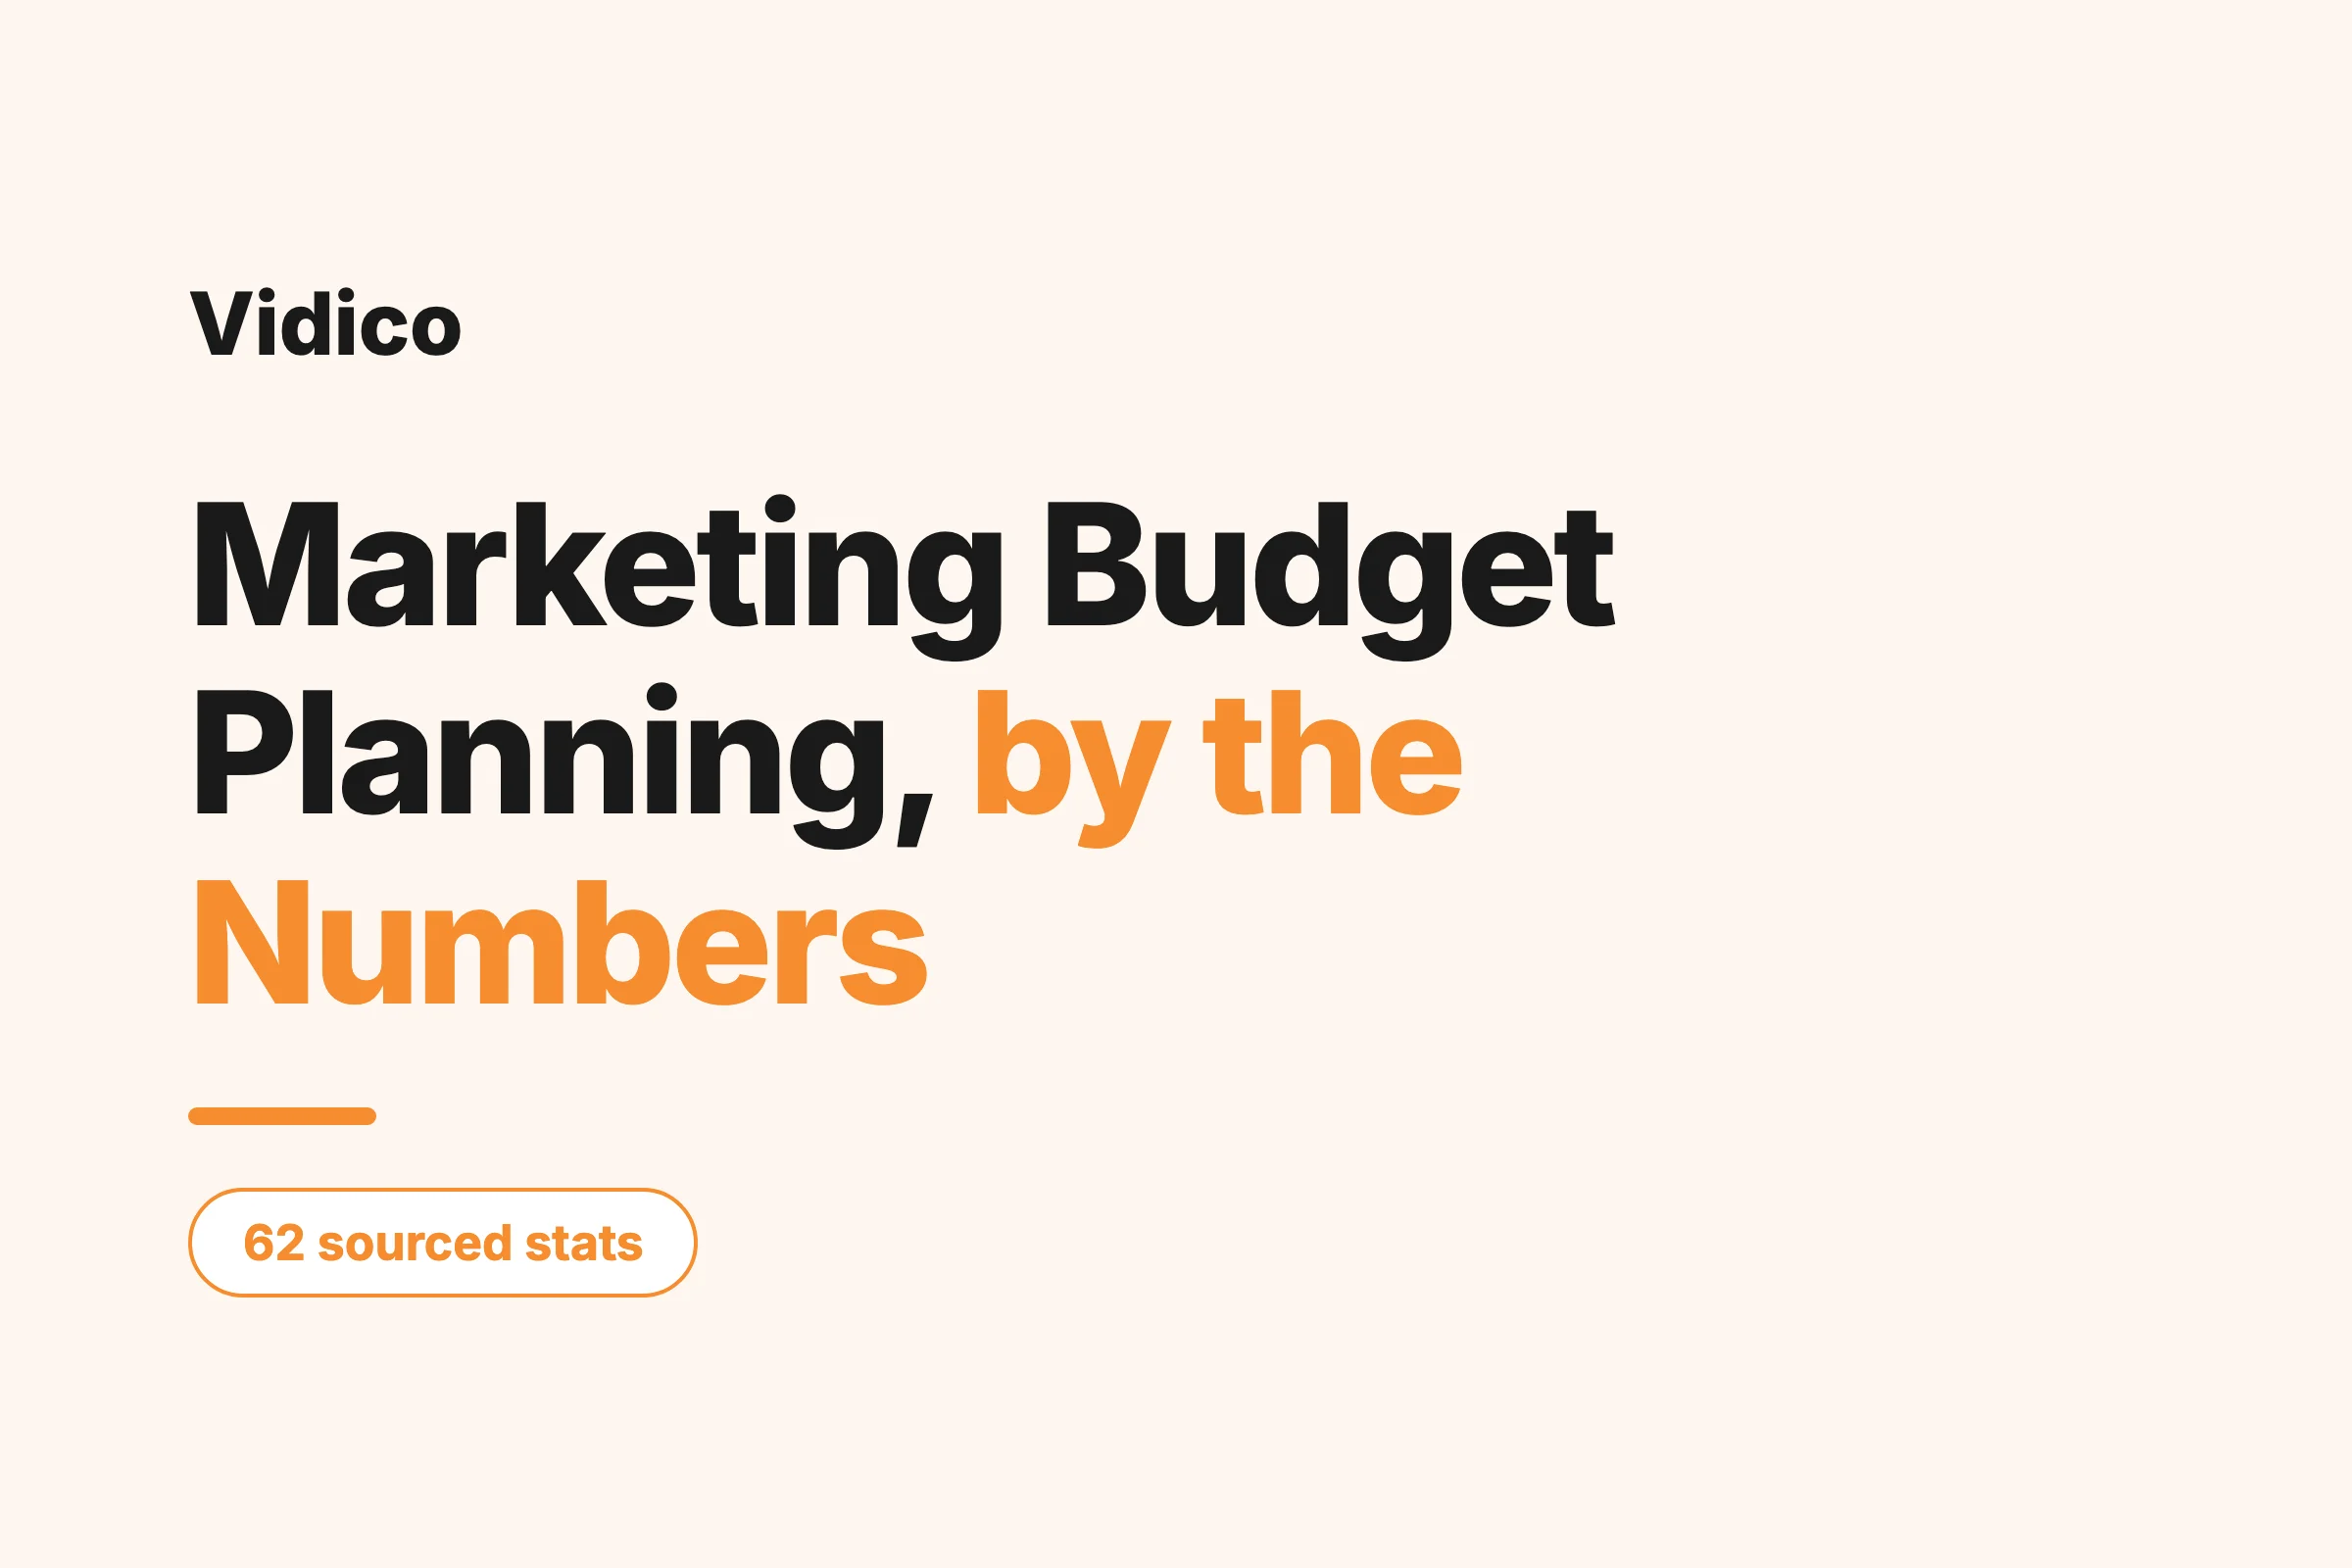
This article compiles 62 sourced statistics on marketing budget allocation, trends, channel splits, and benchmarks by industry and company size. Every stat includes its source and year so you can cite it directly or use it to build your own planning case.
Key Takeaways
- Marketing budgets sit at 7.7-7.8% of company revenue. Gartner’s CMO Spend Survey shows budgets flatlined after dropping from 9.1% in 2022-2023. Deloitte’s CMO Survey puts the figure higher at 9.4%, reflecting different methodologies.
- Paid media is the only budget category growing its share. At 30.6% of total marketing budget, it is now the largest allocation. Martech, labor, and agency spend all declined year over year.
- CMOs allocate 15.3% of budgets to AI, but only 30% are ready to scale. The gap between AI spending and AI readiness is one of the defining budget tensions in 2026.
- 26% of marketing budgets are wasted. Martech underutilization (only 33% of capabilities used), mistargeted ad spend (30.6%), and hidden costs (15-30%) erode budget effectiveness across every category.
- 76% of B2B tech marketers say creative production budgets are increasing. But brand campaigns and creative experimentation are the first line items cut when budgets tighten, according to our State of Creative Marketing in Tech report.
Content
Marketing Budget as a Percentage of Revenue
The most cited benchmark in marketing budget planning is the percentage of total company revenue allocated to marketing. Two major surveys track this number annually, and they consistently disagree.
-
Marketing budgets averaged 7.8% of overall company revenue in 2026, up from 7.7% in 2025. This is a marginal recovery after two years of flat spending following a sharp drop from 9.1% in 2022-2023. (Gartner CMO Spend Survey)
-
Marketing budgets reached 9.4% of company revenues in the Deloitte/Duke CMO Survey, up from 7.7% a year earlier. The CMO Survey uses a different panel and methodology than Gartner, which explains the higher figure. Both are credible. (Deloitte/Duke CMO Survey)
-
Marketing claimed 11.4% of overall company budgets, up from 10.1%. This metric measures marketing’s share of the total company budget (not revenue), and it has been growing even as the revenue percentage fluctuates. (Deloitte/Duke CMO Survey)
-
56% of CMOs say they lack sufficient budget to deliver their 2026 strategy. Another 54% report insufficient resources overall. The budget-to-ambition gap is persistent: in 2025, 59% of CMOs reported the same shortfall. (Gartner CMO Spend Survey)
-
Half of all CMOs report budgets of 6% of revenue or less. While the average sits near 7.8%, the median is lower. A significant share of marketing leaders work with budgets well below the benchmarks that planning frameworks assume. (Gartner CMO Spend Survey)
-
Startups typically allocate 15-30% of projected revenue to marketing. Early-stage companies invest disproportionately in customer acquisition because they lack organic brand awareness and existing customer bases. Mature companies with established market share spend 5-10%. (Industry benchmarks)
Marketing Budget Trends: 2022 to 2026
Budget trends over the past five years show a drop-and-flatten pattern that is only now beginning to reverse.
-
Marketing budgets dropped from 9.1% of revenue in 2022-2023 to 7.7% in 2024, then held flat through 2025 before ticking up to 7.8% in 2026. The 2024 decline erased five years of growth. The recovery is slow. (Gartner CMO Spend Survey)
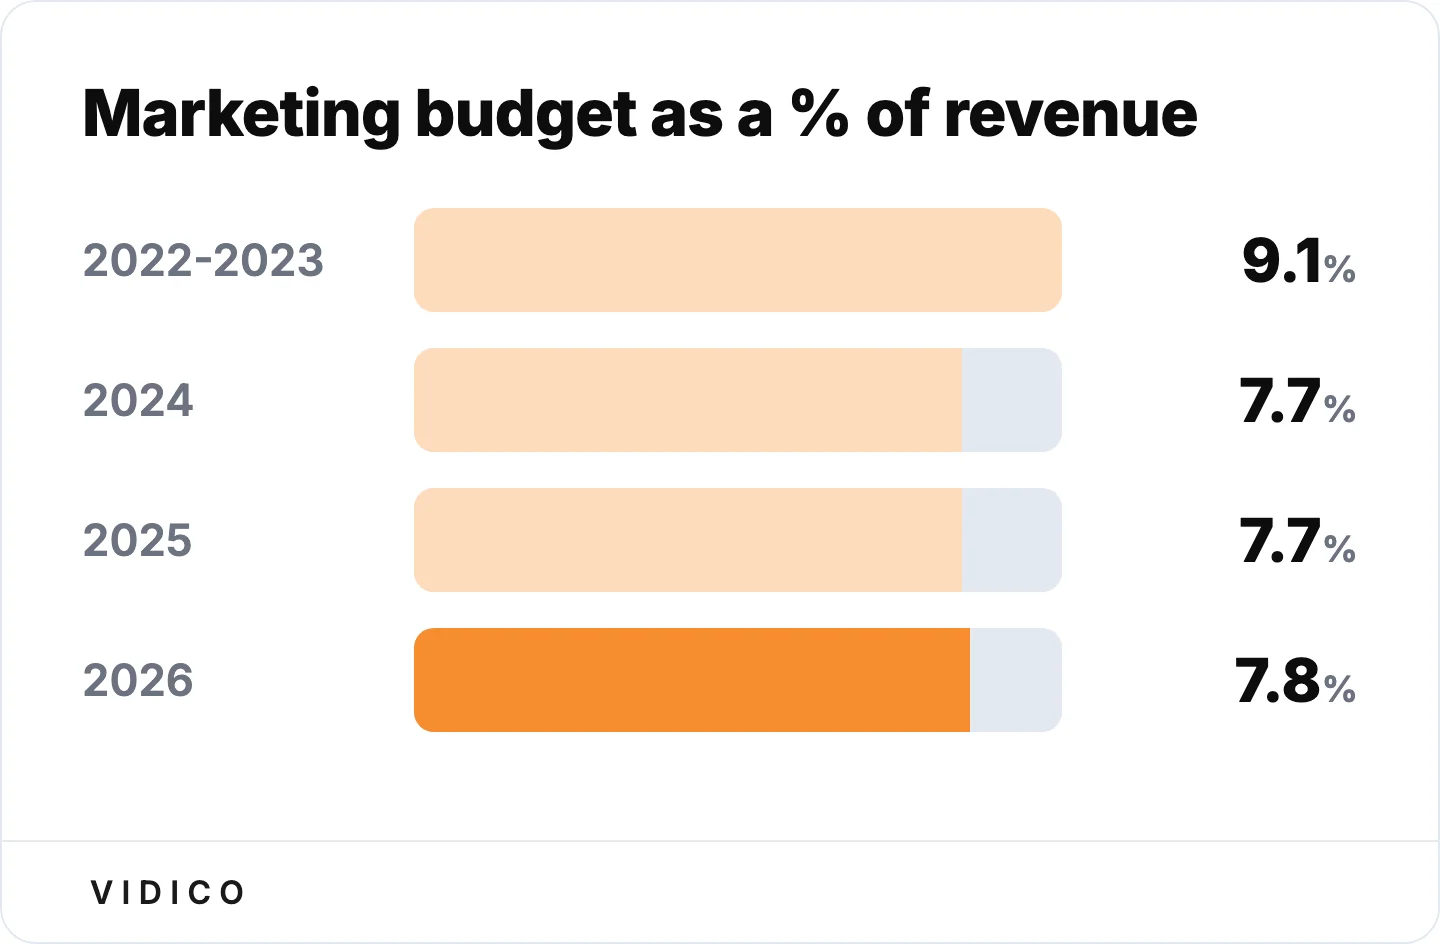
Budgets dropped sharply, then flatlined for two years before a marginal recovery. Source: Gartner CMO Spend Survey.
-
79.2% of marketing teams expect at least a slight budget increase in 2026. Another 21.2% expect significant increases. Only 7% anticipate any decrease. (HubSpot State of Marketing)
-
Marketing leaders anticipate an 8.9% increase in overall marketing spending and an 11.9% increase in digital marketing budgets for 2026. Digital budget growth continues to outpace total budget growth, reflecting the ongoing shift toward digital channels. (Deloitte/Duke CMO Survey)
-
73% of marketers say budgets face more scrutiny than before. Budget increases come with more accountability requirements. Teams are expected to justify every line item with measurable impact. (HubSpot State of Marketing)
For a broader look at how these trends intersect with video marketing trends, video continues to absorb a growing share of the overall marketing budget.
Marketing Budget Allocation by Category
Gartner’s CMO Spend Survey breaks total marketing spend into four categories. The 2025 data shows a clear winner and three losers.
| Category | Share of Budget | YoY Trend |
|---|---|---|
| Paid media | 30.6% | Up 11% |
| Martech | 22.4% | Declined |
| Labor | 21.9% | Declined |
| Agencies | 20.7% | Declined |
-
Paid media commands 30.6% of marketing budgets, up 11% year over year. This is the single largest budget category and the only one that has grown its share over the past five years. (Gartner CMO Spend Survey)
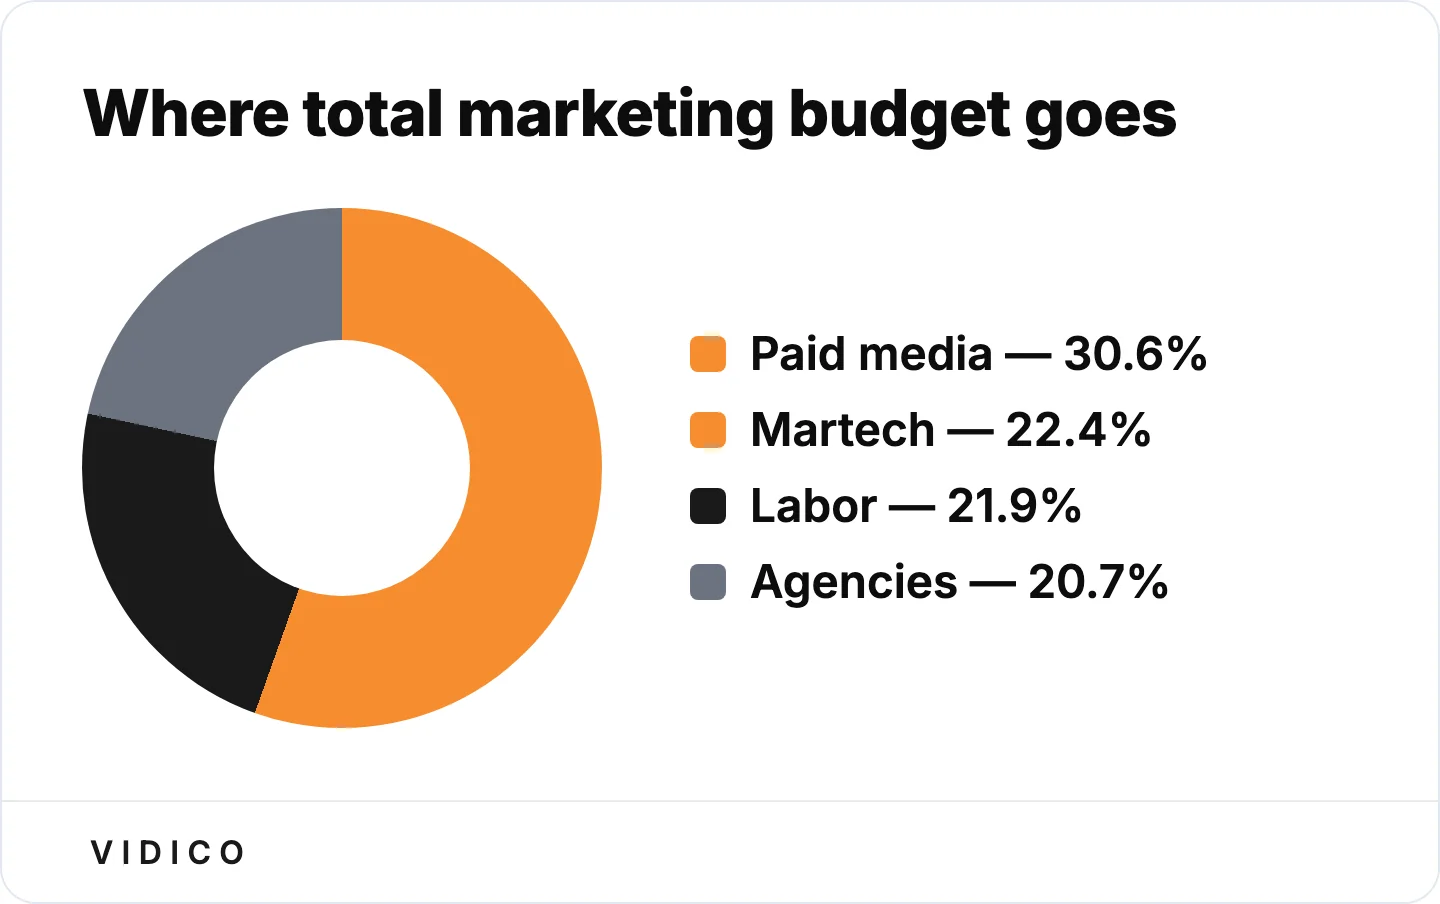

Paid media is now the single largest budget category and the only one growing its share. Source: Gartner CMO Spend Survey.
-
Martech accounts for 22.4% of marketing budgets, declining from its 2024 share. Despite the decline, martech remains the second-largest category. The drop reflects tighter scrutiny on tool ROI. (Gartner CMO Spend Survey)
-
Labor takes 21.9% and agencies take 20.7%, both declining year over year. The squeeze on labor and agency budgets is happening simultaneously. Teams are being asked to do more with smaller headcounts and fewer external partners. (Gartner CMO Spend Survey)
-
Paid media is the only budget category to grow its share over the past five years. Every other category (martech, labor, agencies) has trended down. The shift reflects the increasing cost of paid acquisition and the declining cost of owned and earned channels relative to ad spend. (Gartner CMO Spend Survey)
-
39% of CMOs plan to reduce agency budgets in the next year. The same percentage plan labor reductions. AI, automation, and in-house capabilities are accelerating the move away from external spend. (Gartner)
-
Martech spending is projected to grow from 19.9% to 30.9% of marketing budgets over five years. While Gartner’s data shows a short-term decline, the Deloitte/Duke CMO Survey projects a longer-term increase as AI tools and data platforms become larger line items. (Deloitte/Duke CMO Survey)
-
Only 56.4% of purchased martech tools are being used. Companies are buying more tools but using fewer of them, which feeds the case for consolidation and drives the short-term budget decline. (Deloitte/Duke CMO Survey)
For context on what paid media actually costs by channel, ad costs have risen alongside this allocation shift.
Marketing Budget by Industry
Budget allocation varies significantly by industry. B2C companies consistently outspend B2B, and some verticals invest three to four times more than others as a percentage of revenue.
| Industry | Marketing Budget (% of Revenue) | Source |
|---|---|---|
| CPG | 20-25% | Improvado |
| Professional Services | 18-21% | Improvado |
| B2C Services | 15% | CMO Survey |
| B2C Products | 13.9% | CMO Survey |
| B2B Services | 12% | CMO Survey |
| Tech/SaaS | 11-15% | Improvado |
| B2B Products | 8.3% | CMO Survey |
| Manufacturing | 5-7% | Improvado |
-
Tech and SaaS companies allocate 11-15% of revenue to marketing. This range reflects the high cost of customer acquisition in competitive SaaS markets, where paid channels, content, and product-led growth all require sustained investment. (Improvado)
-
CPG brands lead at 20-25% of revenue. Consumer packaged goods companies invest heavily in brand awareness and retail distribution support, which drives their outsized marketing spend. (Improvado)
-
Professional services firms allocate 18-21%. This includes legal, consulting, and accounting firms where marketing drives new client acquisition in the absence of a product. (Improvado)
-
Manufacturing and industrial companies spend the least at 5-7%. Shorter sales cycles, smaller buyer pools, and relationship-driven sales reduce the need for broad marketing investment. (Improvado)
-
B2B companies that sell products spend 8.3% of revenue on marketing. B2B services companies spend 12%. The gap reflects the higher customer acquisition cost in services businesses, where differentiation is harder and sales cycles are longer. (CMO Survey)
-
B2C companies that sell services spend 15% of revenue. B2C product companies spend 13.9%. Both outspend their B2B counterparts, driven by larger addressable markets and higher marketing saturation. (CMO Survey)
-
Early-stage B2B SaaS companies spend 20-30% of revenue on marketing. Mature SaaS companies spend 5-7%. As SaaS companies move past product-market fit and build organic acquisition channels, the marketing-to-revenue ratio drops sharply. (Industry benchmarks)
For teams in the digital marketing for tech companies space, the 11-15% range is the planning baseline.
Need to benchmark your creative spend against your industry? Our Creative Intelligence Report is a free competitive analysis that shows how your creative production stacks up against your direct competitors. Delivered in 48 hours.
Marketing Budget by Company Size
Smaller companies allocate a larger percentage of their total budget to marketing, but spend far less in absolute dollars. As companies grow, marketing’s share of the total budget shrinks.
-
Companies with fewer than 100 employees allocate 46% of their total budget to marketing. Small teams funnel a disproportionate share of resources into growth because they lack brand recognition and existing customer bases. (CMO Survey)
-
Companies with 100-499 employees allocate 33% of their total budget to marketing. The drop from 46% reflects the emergence of dedicated departments and non-marketing cost centers at this stage. (CMO Survey)
-
Companies with 500-999 employees allocate just 12% to marketing. At mid-market size, marketing competes with engineering, sales, and operations for a fixed budget pool. (CMO Survey)
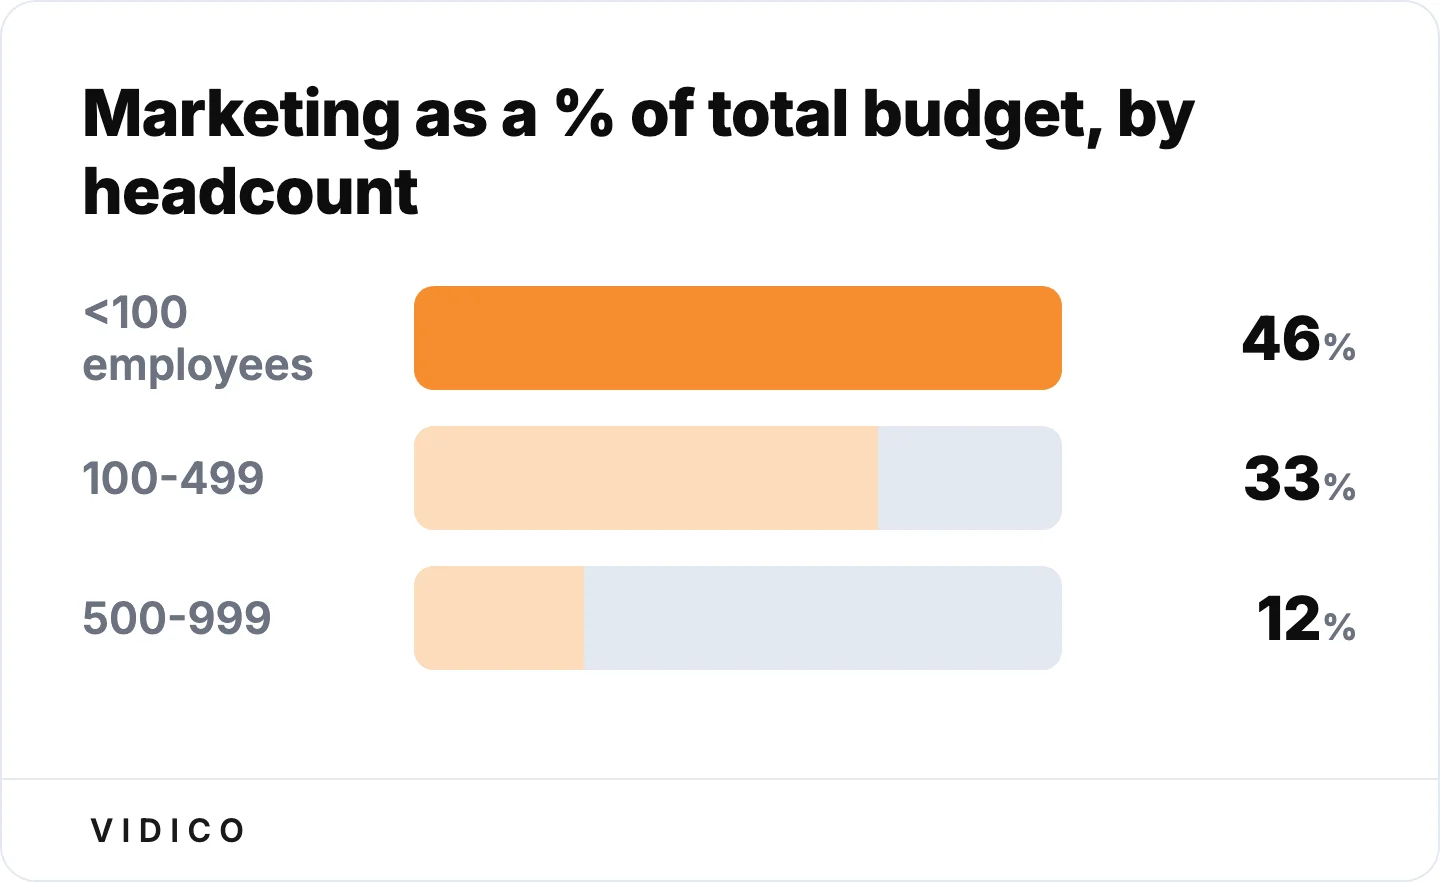

Marketing’s share of the total budget shrinks fast as headcount grows. Source: CMO Survey.
-
66.3% of small business owners spend less than $1,000 per year on marketing. This stat captures the reality for the majority of small businesses: budget constraints make paid channels nearly inaccessible, pushing them toward organic and referral strategies. (BizIQ)
-
60% of small businesses plan to increase their marketing budgets in 2026. Despite historically low spend levels, the intent to invest more is widespread. The gap between intent and execution remains large. (Clutch.co)
Channel-Level Budget Allocation
Where the money goes within a marketing budget depends on the company’s goals, industry, and growth stage. These benchmarks show average allocation by channel with corresponding ROI ranges.
| Channel | Budget Allocation | Average ROI |
|---|---|---|
| Content marketing + SEO | 25-30% | 5:1 to 10:1 |
| Email marketing | 15-20% | 20:1 to 40:1 |
| Paid search | 10-15% | 2:1 to 4:1 |
| Paid social | 10-15% | 1.5:1 to 3:1 |
| Video marketing | 10-12% | 3:1 to 6:1 |
| Influencer/partnerships | 5-8% | 5.78:1 avg |
-
Digital channels account for 61.1% of total marketing spend, the highest share since Gartner began tracking in 2013. The digital share has been rising steadily, but the pace accelerated after 2020. (Gartner)
-
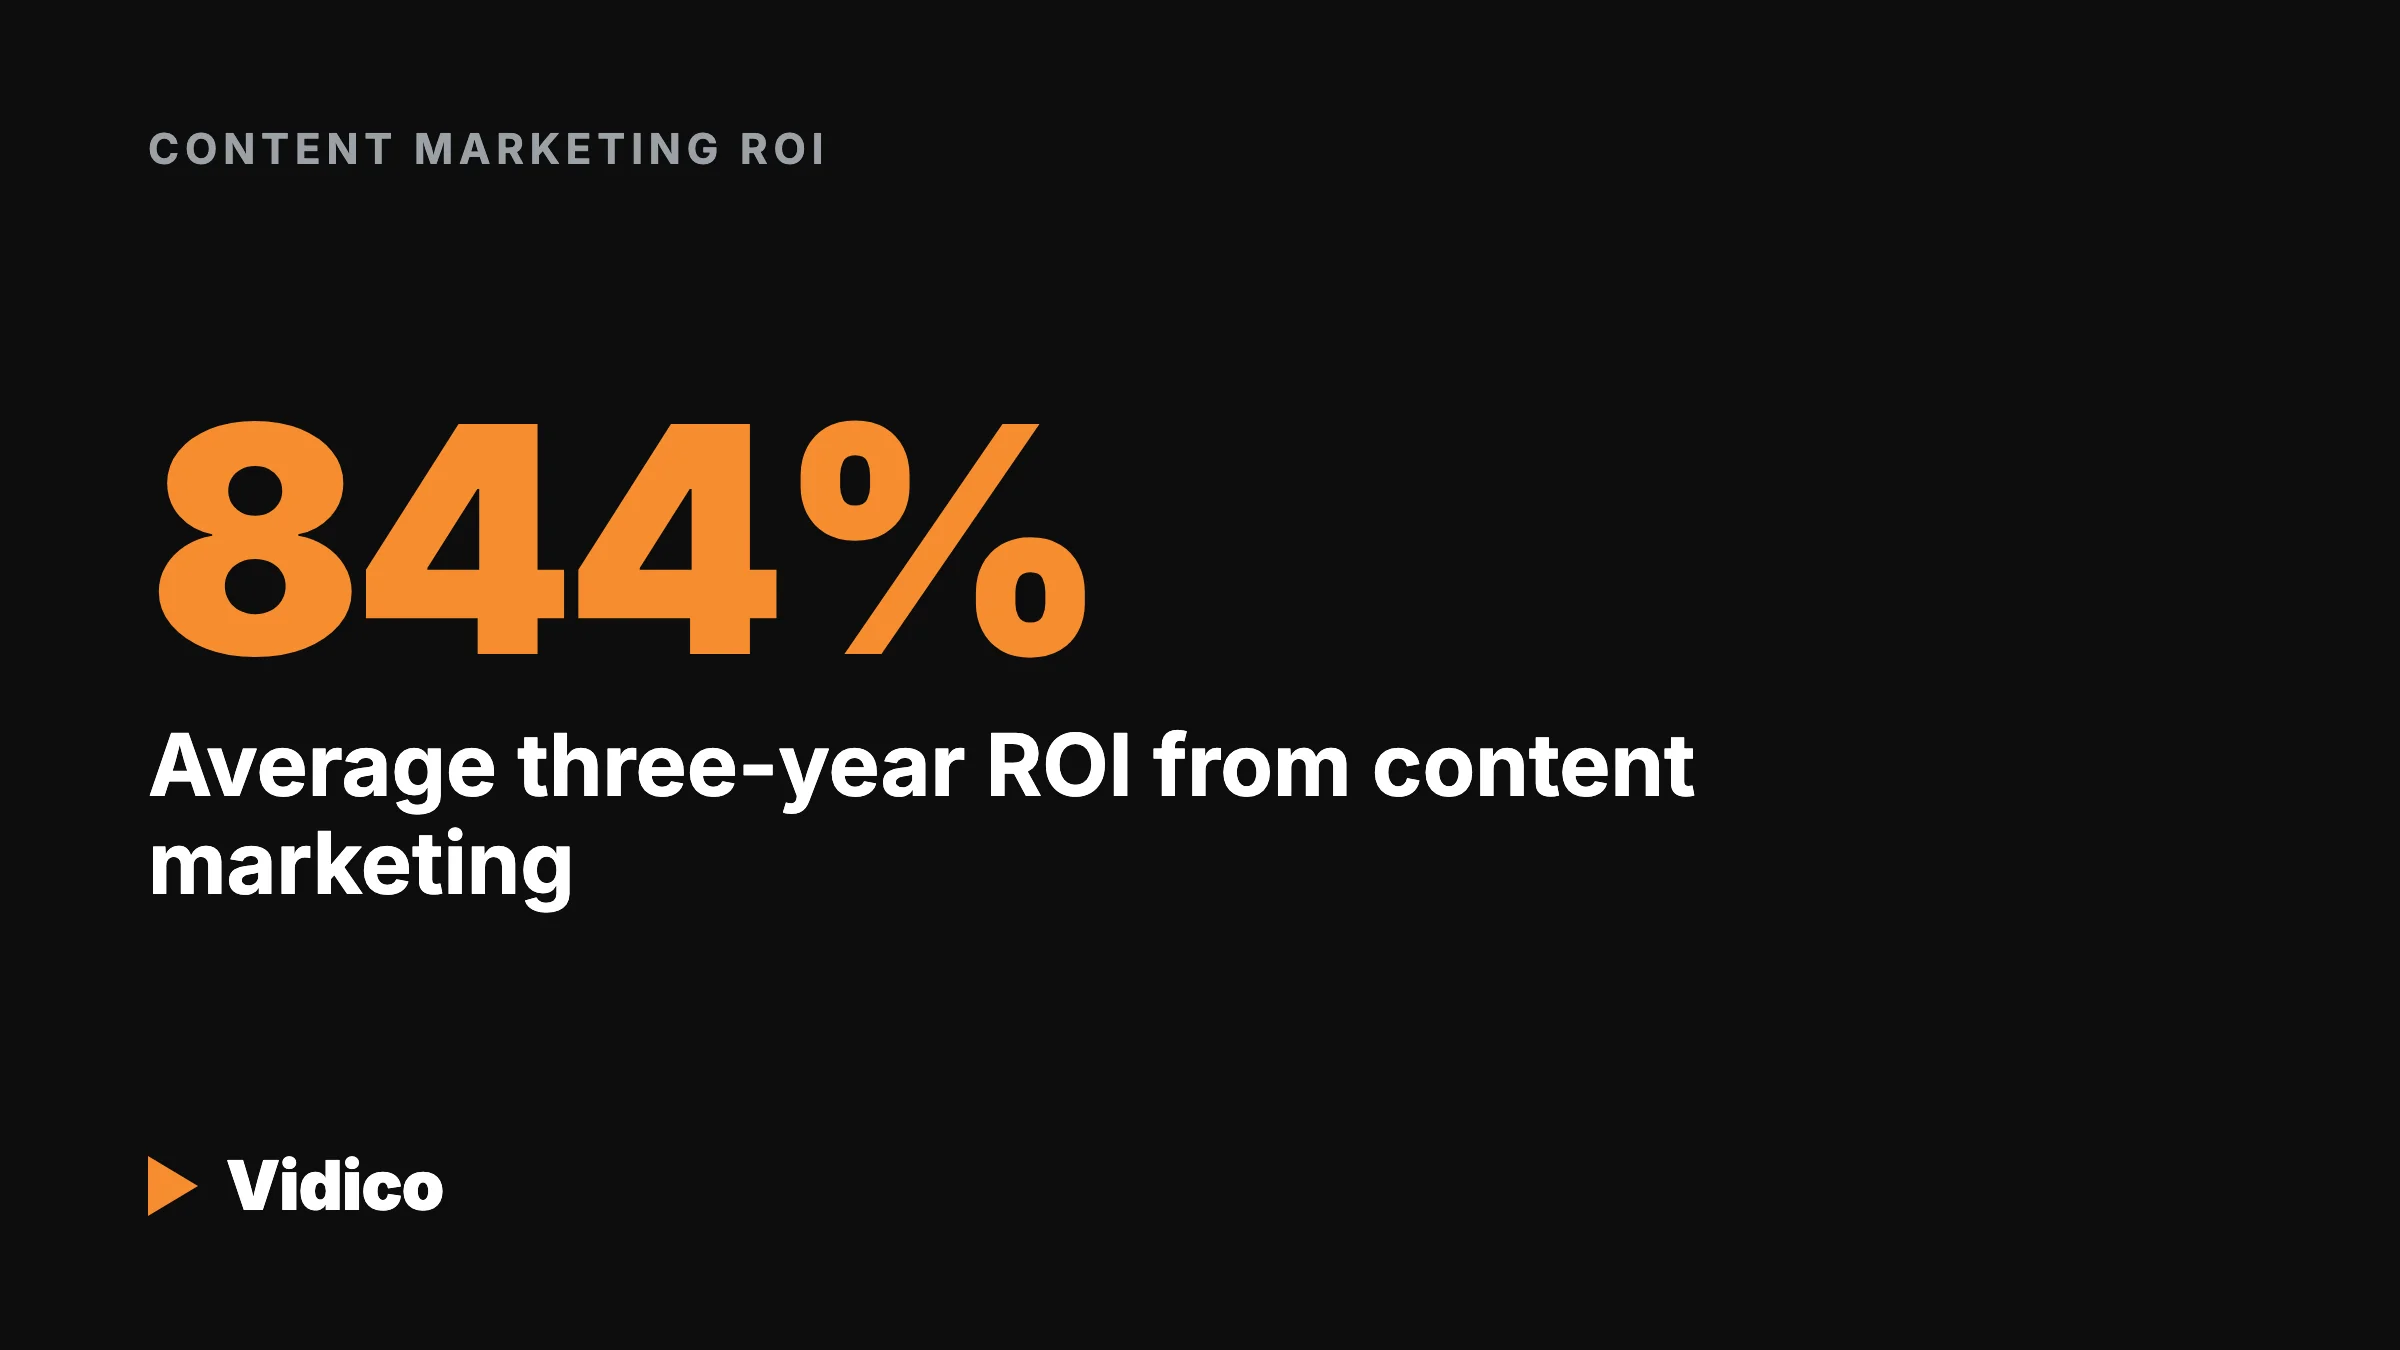
Content marketing and SEO together command 25-30% of the average marketing budget, with a 5:1 to 10:1 ROI range. This makes it the largest single channel allocation and one of the highest ROI channels over time. (Improvado)
-
Email marketing takes 15-20% of budget, with the highest ROI of any channel at 20:1 to 40:1. Despite its age, email remains the most efficient channel by return per dollar spent. (Improvado)
-
Video marketing commands 10-12% of budget, with a 3:1 to 6:1 ROI. Video’s share has grown faster than any other content format. For more on video’s ROI, the trend accelerates when teams build reusable template systems that lower per-asset costs over time. (Improvado)
-
Influencer and partnership marketing takes 5-8% of budget, with an average ROI of 5.78:1 and 14.1% year-over-year growth. This is the fastest-growing channel category, and partnerships have overtaken paid social as the top-cited growth channel for 2026. (Improvado)
-
Awareness and conversion together account for 62.6% of total media spend in 2026, up more than 10% since 2024. Marketers are shifting budget toward the top and bottom of the funnel. (Gartner)
-
Customer loyalty and retention spending has declined 29% since 2024, falling below 15% of total media spend. The rebalancing toward acquisition means retention programs are losing budget share, even as customer lifetime value becomes a larger focus in strategic planning. (Gartner)
-
49% of marketers rank organic search and SEO as the best ROI channel. Organic search consistently outranks paid channels in efficiency surveys because the cost of acquisition declines over time as content compounds. For a deeper look at video marketing statistics, video is now the second-highest ROI content format after long-form written content. (HubSpot State of Marketing)
Planning your 2026 video marketing strategy? Get a free video marketing plan tailored to your goals, channels, and budget.
AI Marketing Budget Statistics
AI has become its own budget category. The allocation is growing faster than any other line item, but most teams lack the infrastructure to scale what they are building.
-
CMOs allocate 15.3% of their total marketing budget to AI initiatives. This makes AI a larger line item than most individual channels. A year ago, AI did not register as a standalone budget category in most marketing plans. (Gartner CMO Spend Survey)
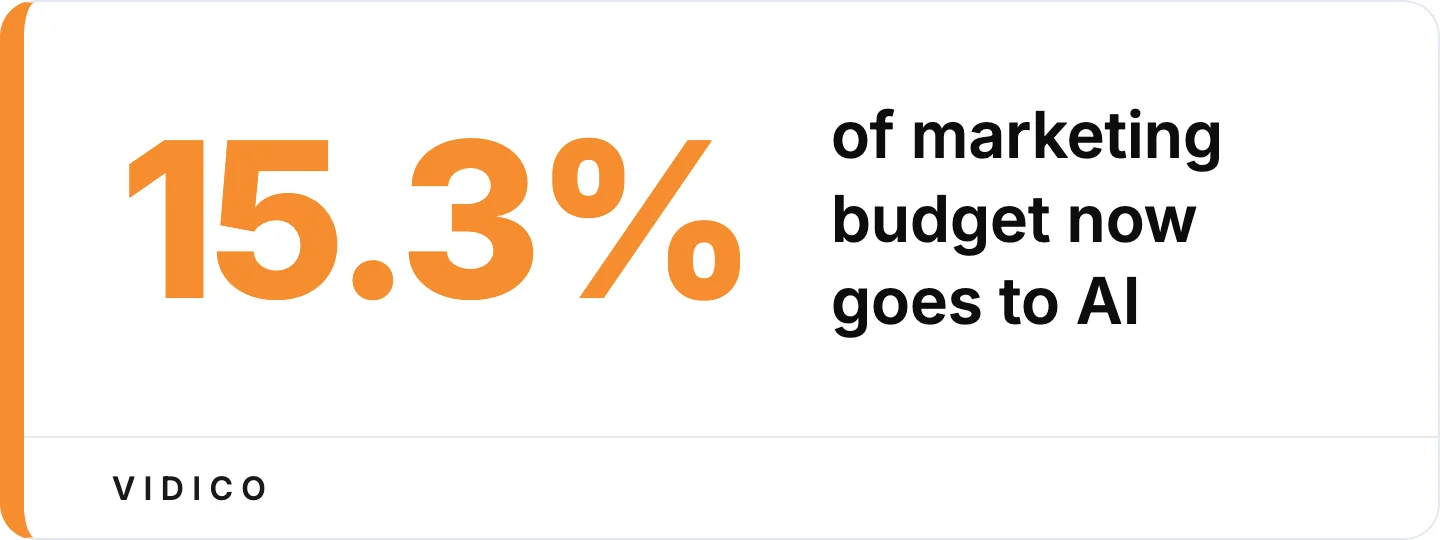

AI is now a larger line item than most individual channels, yet only 30% of CMOs are ready to scale it. Source: Gartner CMO Spend Survey.
-
AI-ready organizations allocate 21.3% to AI, compared to the 15.3% average. Teams with mature AI capabilities invest 39% more. The spend gap between leaders and laggards is widening. (Gartner CMO Spend Survey)
-
Only 30% of CMOs have mature AI readiness capabilities. The remaining 70% are investing in AI without the data infrastructure, governance, or workflows to extract full value. (Gartner CMO Spend Survey)
-
AI powers 17.2% of all marketing efforts, a 100% increase since 2022. The doubling reflects rapid adoption of AI for content creation, ad optimization, audience segmentation, and attribution. (Deloitte/Duke CMO Survey)
-
Only 29% of B2B tech marketing teams have a formalized AI governance policy. Nearly half are still building one. Budget allocation without governance creates compliance and quality risks. (Our State of Creative Marketing in Tech report)
Marketing Budget Waste Statistics
Budget effectiveness breaks down in three areas: ad targeting, tool underutilization, and hidden costs that do not appear as line items.
-
26% of marketing budgets are wasted. The waste comes from misallocated spend, poor targeting, and tool redundancy rather than a single failure point. (Deep Marketing)
-
30.6% of digital ad spend is wasted on mistargeted audiences, low-quality placements, and tracking errors. Nearly one in three dollars in digital advertising reaches the wrong person or the wrong placement. (Improvado)
-
Marketers use only 33% of their martech stack capabilities, down from 42% in 2022 and 58% in 2020. The utilization rate has been dropping for six consecutive years. Teams are buying more tools but using less of each tool’s functionality. (Gartner)
-
Hidden costs consume 15-30% of marketing budgets. These include agency markups (8-15%), overlapping martech tools (5-12%), and unmeasured organic social labor (3-8%). Most teams do not track these costs as separate line items. (Improvado)
-
70% of leaders are confident their budgets work well, yet 41.6% admit to wasted spend. The confidence-waste gap suggests that budget optimization is harder to self-assess than most leaders think. (PPC.land)
-
Programmatic ad waste reached $26.8 billion in 2025. Invalid traffic, bot fraud, and non-viewable impressions accounted for most of the loss. The global invalid traffic rate sits at 20.64%, meaning roughly one in five impressions is not seen by a real person. (Improvado)
Creative Production Budget Statistics
Creative production is a distinct budget category that most industry benchmarks do not track separately. We surveyed 230+ B2B tech marketing leaders for our State of Creative Marketing in Tech report to fill that gap. The stats below combine our survey findings with broader industry data on creative spend.
-
76% of B2B tech marketing leaders report increasing their creative production budget this year. Creative production is absorbing a larger share of total marketing spend as teams invest in video, design, and animation for multi-channel campaigns. (Our State of Creative Marketing in Tech report)
-
Creative production claims 21-35% of total marketing budget for 42.7% of B2B tech teams, with another 35.9% spending 10-20%. That puts roughly four in five teams in the 10-35% range for creative, making it one of the largest single line items after paid media. (Our State of Creative Marketing in Tech report)
-
The first budget lines to go: brand campaigns at 17.5% and creative experimentation at 17.1%. Always-on content production sits at the opposite end, with just 9.0% of teams naming it as a likely cut. Ongoing output survives; brand and innovation absorb the squeeze. (Our State of Creative Marketing in Tech report)
-
Budget is the single biggest constraint for creative production teams, cited by 27.4%. Measurement and attribution (14.1%), slow internal approvals (13.2%), and bandwidth/headcount (12.8%) follow. (Our State of Creative Marketing in Tech report)
-
92% of marketers plan to spend the same or more on video in 2026. 49% plan to increase their video budget and 43% plan to maintain current levels. Only 8% plan to decrease. (Wyzowl)
-
Creator advertising spending reached $37 billion in 2025 and is projected to hit $44 billion in 2026. Creator content now accounts for 44% of brands’ paid media creative assets on average. (CreatorIQ)
-
U.S. digital video ad spend is projected at $72 billion in 2025, up 18% year over year. Video is the fastest-growing digital ad format by total dollars spent. (eMarketer)
For context on what individual marketing videos actually cost to produce, production costs vary from $1,000 for AI-assisted clips to $50,000+ for broadcast-quality campaigns.
Want the full creative production benchmark data? Download our State of Creative Marketing in Tech report for the complete survey results from 230+ B2B tech marketing leaders.
Content Marketing Budget Statistics
Content marketing is one line item within the broader marketing budget. These three stats provide the baseline. For a fuller picture of content marketing performance and ROI, see our separate content marketing statistics resource.
-
55% of businesses allocate between 11% and 50% of their total marketing budget to content marketing. The distribution is wide. About 27% spend less than 10%, and 18% spend more than half. (CMI)
-
46% of B2B marketers expect their content budget to increase in 2026. 41% expect it to hold steady. Only 8% anticipate a decrease. Content is one of the most budget-protected categories across both B2B and B2C. (CMI)
-
61% of B2B marketers plan to increase video content spending specifically. Video is absorbing a growing share of the content budget as teams shift from text-only formats to video-first and multimedia strategies. See B2B video marketing statistics for more on this shift. (CMI)
Budget Planning and Forecasting Statistics
How teams plan their budgets matters as much as how much they spend. These stats cover planning practices, reserve strategies, and common failure patterns.
-
85% of small and mid-sized businesses operate from budgets alone, without a written strategic plan. Budget without strategy leads to reactive allocation. The budget becomes a spending tracker rather than a planning tool. (MarketingMO)
-
High-performing teams allocate 18% of their budget to reserve funds for mid-year reallocation. Bottom-quartile teams allocate just 3%. The 6x gap in reserve allocation is one of the strongest predictors of budget performance. Reserves allow teams to capitalize on opportunities without pulling from existing commitments. (Improvado)
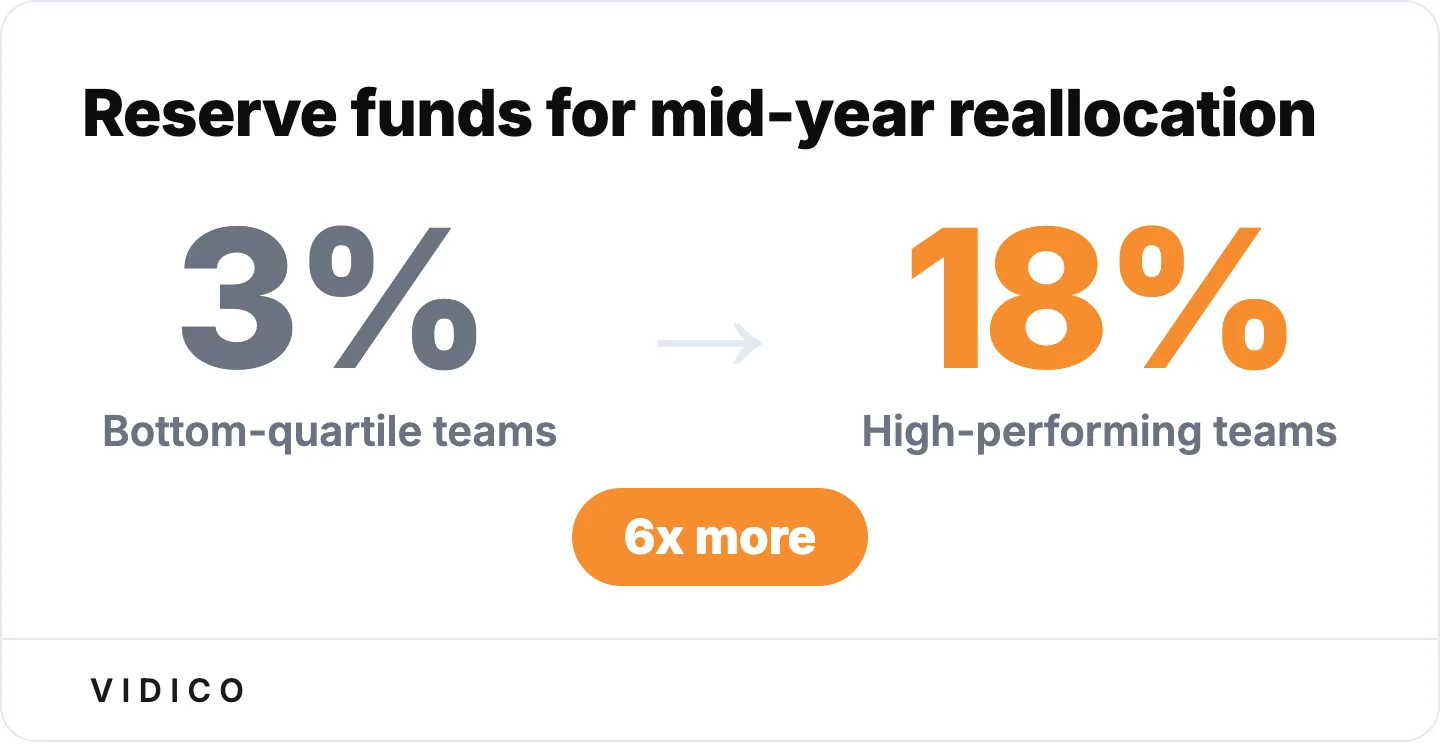

A 6x gap in reserve allocation is one of the strongest predictors of budget performance. Source: Improvado.
-
68% of failed budget plans over-allocated to low-intent channels. Another 52% ignored attribution lag, and 41% under-reserved for seasonal fluctuations. These three failure patterns account for the majority of budget plan breakdowns. (Improvado)
-
45% of teams allocate 10-20% of their budget to testing new channels. Teams that test at this level report faster identification of high-performing channels and earlier exit from underperforming ones. (HubSpot State of Marketing)
Frequently Asked Questions
What percentage of revenue should a company spend on marketing?
The standard benchmark is 7.7-7.8% of total company revenue, based on Gartner’s CMO Spend Survey. The Deloitte/Duke CMO Survey puts the figure higher at 9.4%. Startups typically spend 15-30% of projected revenue, while established companies with steady revenue target 5-10%. The right percentage depends on your growth stage, industry, and competitive landscape.
What is the 70/20/10 rule for marketing budget?
The 70/20/10 rule allocates 70% of the marketing budget to proven, reliable channels, 20% to emerging channels with strong but unproven potential, and 10% to experimental or untested channels. According to HubSpot, 45% of teams already allocate 10-20% of their budget to testing new channels, which aligns with the rule’s experimental tier.
How much of the marketing budget should go to digital?
Digital channels account for 61.1% of total marketing spend on average, per Gartner. This is the highest share since tracking began in 2013, and the trend continues upward. Within digital, search (13.6%), social advertising (12.2%), and digital display (10.7%) are the largest sub-categories.
The Bottom Line
Marketing budgets are recovering, but slowly. At 7.8% of revenue, they remain well below the 9.1% peak from 2022-2023, and over half of CMOs say it is still not enough. The meaningful shifts are happening inside the budget, not in its total size. Paid media is absorbing more. Agencies and labor are losing share. AI has become a standalone line item at 15.3% of budgets. And creative production budgets are growing for 76% of B2B tech teams even as brand campaigns and experimentation get cut.
Vidico produces B2B explainer videos for SaaS and tech brands, with 2,000+ campaigns shipped for companies like Square, Spotify, and NinjaOne. The budget allocation data in our State of Creative Marketing in Tech report captures how 230+ marketing leaders plan their creative spend, including the creative production line items where we operate.
The stats in this article are a snapshot. Budgets shift quarterly. Bookmark this page for the most current benchmarks, or book a strategy session to talk through how these benchmarks apply to your specific team and growth stage.
Sources
- Gartner: CMO Spend Survey
- Gartner: CMO Spend Survey
- Gartner: Digital Channels Marketing Spend
- Gartner: Media Spend by Funnel Stage
- Gartner: CMO Labor and Agency Reductions
- Gartner: Martech Utilization
- Deloitte/Duke CMO Survey: Marketing Budget Trends
- Deloitte/Duke CMO Survey: Martech Spending
- HubSpot: State of Marketing
- Improvado: Marketing Budget Allocation Guide
- Improvado: Ad Spend Optimization Guide
- CMO Survey
- CMI/SociallyIn: Content Marketing Statistics
- SEOProfy: Content Marketing Statistics
- BizIQ: Small Business Marketing Statistics
- Clutch.co: Marketing Budget Planning
- Deep Marketing: Marketing Budget Waste
- MarketingMO: Marketing Plans and Budgets
- Wyzowl/Blondish: Video Marketing Statistics
- CreatorIQ: Creator Advertising Spend
- eMarketer: Digital Ad Spending Forecast
- XanderMarketing: SaaS Marketing Budget Benchmarks
- PPC.land: Marketing Budget Confidence vs. Waste