Content marketing generates three times more leads than outbound marketing and costs 62% less. That stat is over a decade old, and the gap has only widened since.
The global content marketing industry is on track to exceed $900 billion by 2030. Budgets are climbing, AI adoption has hit near-universal levels, and video has overtaken every other format in both spend and return.
But the data also reveals friction. Most marketers say their content strategy works, yet fewer than a third call it “very effective.” AI tools are everywhere, but governance is almost nowhere. Creative fatigue is accelerating, and production bottlenecks still slow down teams that need to ship weekly, not quarterly.
We compiled 90 stats from the latest industry reports, including original data from our State of Creative Marketing in Tech report surveying 230+ B2B tech marketing leaders. Here is what the numbers say heading into the back half of 2026.
Key Takeaways
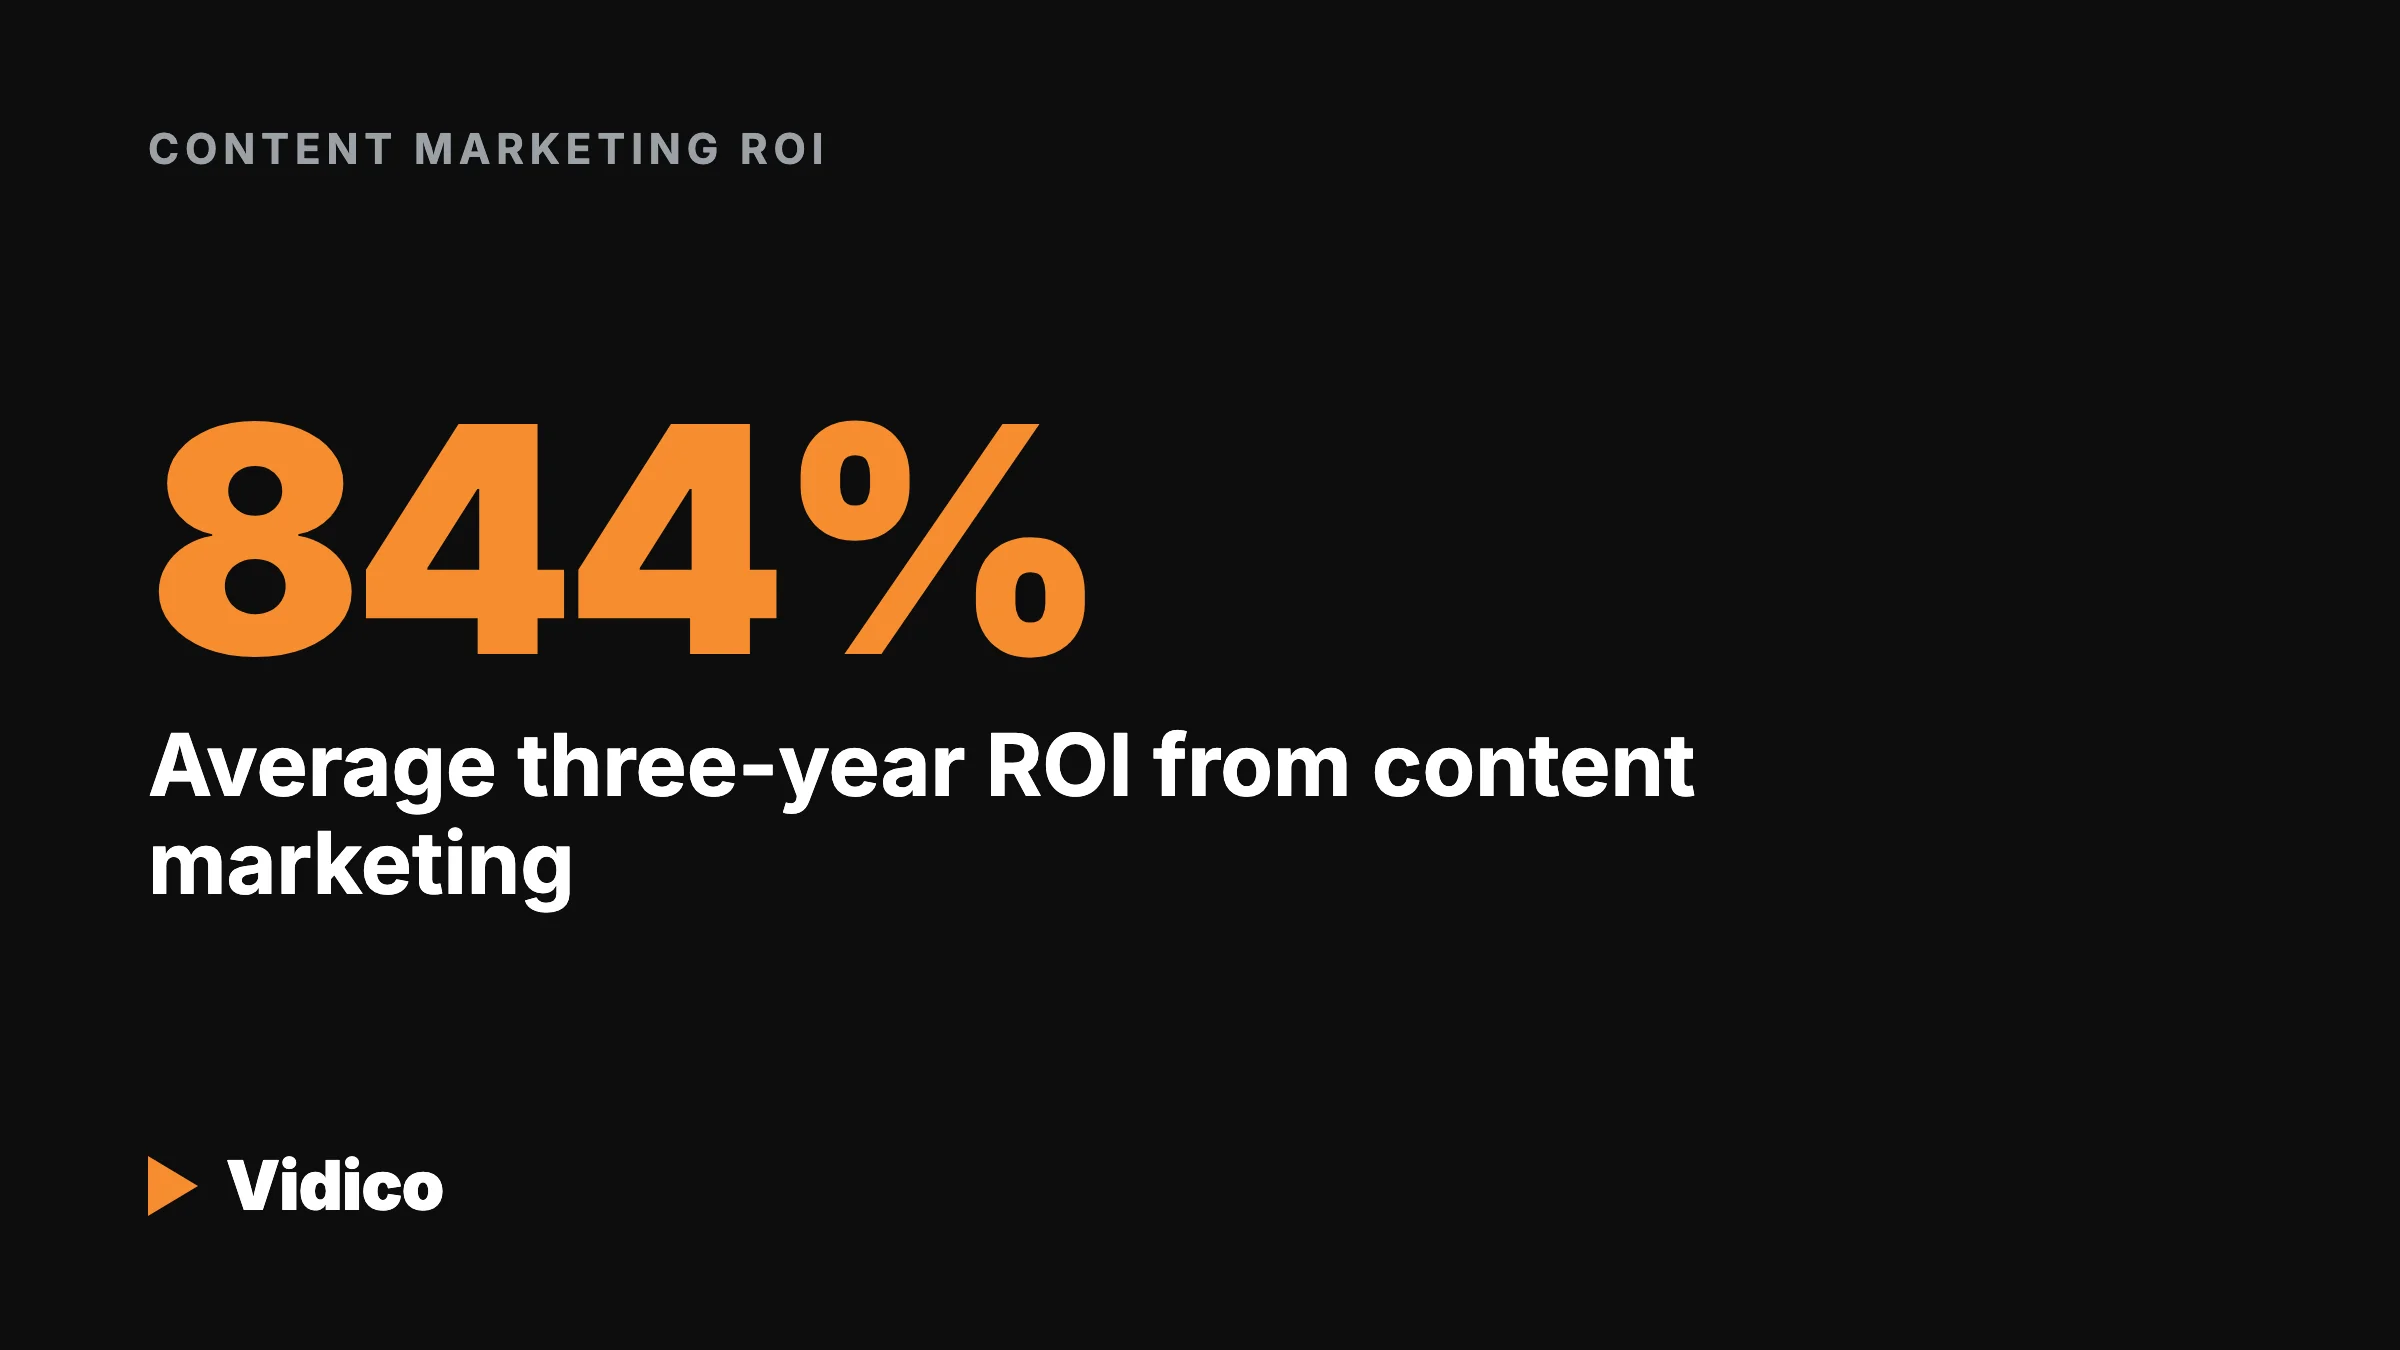
- Content marketing generates 3x more leads than outbound and costs 62% less, with a three-year average ROI of 844% (DemandMetric, FirstPageSage)
- 91% of businesses now use video as a marketing tool and 82% say it delivers strong ROI, making video the single most adopted content format (Wyzowl)
- 94% of marketers plan to use AI for content creation in 2026 but only 29% have a formalized AI governance policy (HubSpot, our State of Creative report)
- 97% of marketers include content marketing in their strategy yet only 29% rate their efforts “extremely or very effective,” pointing to an execution gap (Semrush, CMI)
- 76% of B2B tech marketing teams are increasing creative production budgets and always-on content volume is the budget line most protected from cuts (our State of Creative report)
Content
Top Content Marketing Statistics
-
97% of marketers include content marketing in their overall strategy. This makes content marketing nearly universal among businesses with an active marketing function. (Semrush)
-
The global content marketing market is projected to exceed $900 billion by 2030. Annual growth sits around 10.4%, with a compound annual growth rate of 13-14%. (Statista)
-
Content marketing generates 3x more leads than traditional outbound marketing and costs 62% less. This remains the most widely cited benchmark for the channel’s cost efficiency. (DemandMetric)
-
29% of marketers actively use content marketing as their primary channel. While 97% include it in their broader strategy, fewer than a third treat it as the primary driver. (HubSpot)
-
78% of companies that report very successful content marketing have a documented strategy. Documentation correlates with success more than budget size or team headcount. (Semrush)
-
42% of B2B tech marketing leaders say getting audience attention is harder now than a year ago. More competition and content sameness are the primary drivers. (Our State of Creative Marketing in Tech report)
-
35% cite accelerating creative fatigue as a top challenge. Audiences are tuning out repetitive content faster, which puts pressure on teams to produce more original, differentiated work. (Our State of Creative Marketing in Tech report)
Content Marketing ROI Statistics
Content marketing consistently outperforms paid channels on long-term return, though the timeline varies by industry and format.
-
The average three-year ROI for content marketing is 844%. ROI breaks even around month 7, reaches 300% by month 12, and exceeds 1,100% by month 36. (FirstPageSage)
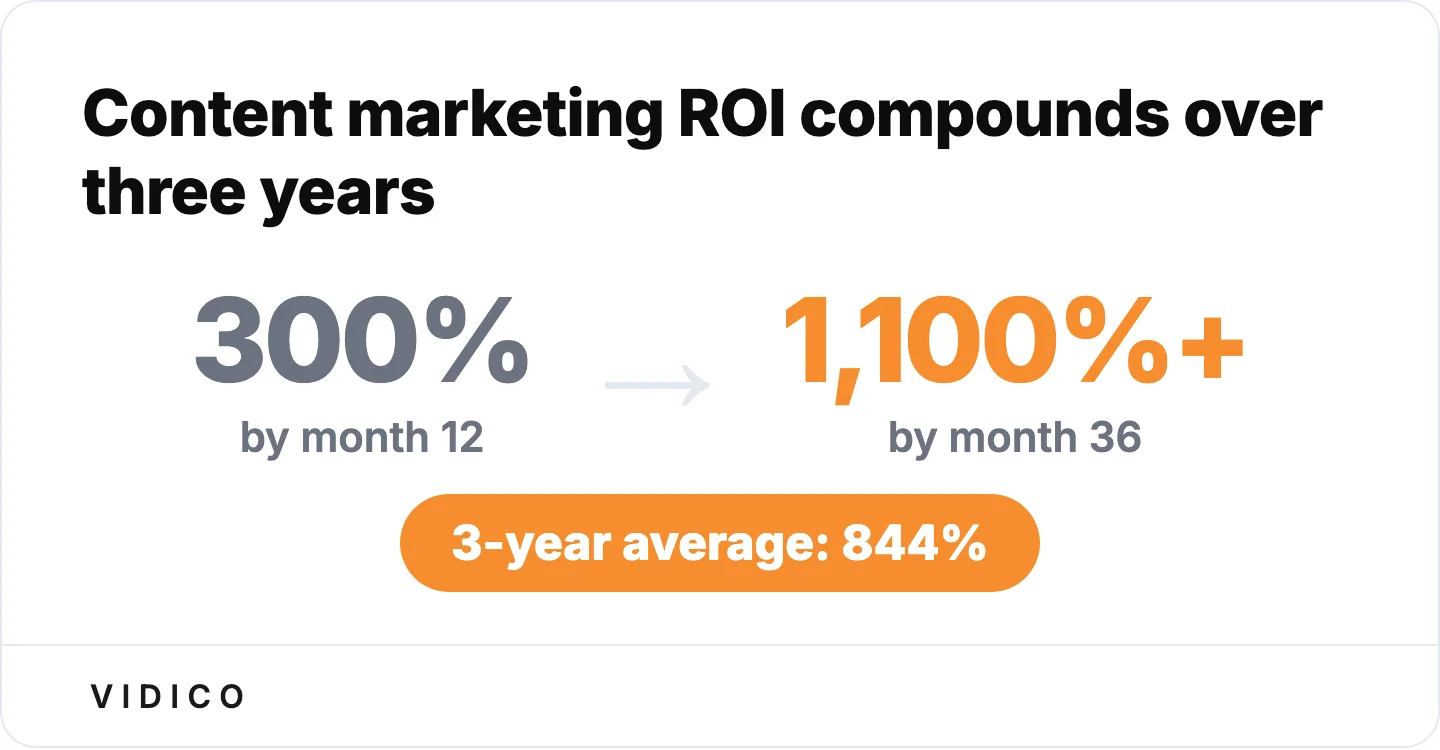
Content marketing ROI compounds: 300% by month 12, over 1,100% by month 36, a three-year average of 844% (FirstPageSage).
-
58% of marketers say content marketing generates direct sales and revenue. Lead generation and brand awareness remain the primary goals, but more teams now tie content directly to pipeline. (CMI)
-
74% say content marketing helps generate demand and leads. This is the single most cited benefit, ahead of brand awareness (81%), audience nurturing (62%), and direct revenue (49%). (CMI)
-
81% say content marketing builds brand awareness. While harder to measure than leads, brand awareness ranks as the top reported benefit across both B2B and B2C teams. (CMI)
-
B2B SaaS content marketing delivers the highest industry ROI at 420%. Financial services follows at 380%, and education and online learning comes in at 400%. (FirstPageSage)
| Industry | Content Marketing ROI |
|---|---|
| B2B SaaS | 420% |
| Education / Online Learning | 400% |
| Financial Services | 380% |
-
For every $1,000 spent on short-form video, marketers attribute $8,900 in sales. This makes short-form video the highest-return content format by dollar-for-dollar attribution. (HubSpot)
-
Email marketing returns $36-42 for every $1 spent. Despite being one of the oldest digital channels, email remains the highest-ROI distribution method available. (DemandMetric)
-
52.1% of marketing teams measure content success by engagement and views. Revenue influenced (36.3%) and conversion rate or cost per lead (35.0%) are the next most common metrics. (Our State of Creative Marketing in Tech report)
-
Website, blog, and SEO is the #1 ROI-generating marketing channel at 27%. Paid social media content follows at 26%, making organic and paid content the two highest-performing channels. (HubSpot)
For a closer look at video-specific returns, see our ROI of video marketing breakdown.
Get the full 2026 State of Creative Marketing in Tech report to see how 230+ B2B tech marketing leaders are allocating budgets, measuring ROI, and adopting AI.
Content Strategy Statistics
Most marketers have a content strategy. Far fewer have one that works. The gap between “having a strategy” and “executing it well” shows up across every survey.
-
97% of marketers have a content strategy for 2026, but only 47% have it formally documented. The documentation gap is one of the strongest predictors of underperformance. (CMI)
-
73% of B2B marketers have a documented content strategy. B2B teams are more likely to document than the broader marketing population, likely because longer sales cycles require more coordinated content. (CMI)
-
Only 29% rate their content marketing efforts as “extremely or very effective.” This means over 70% of marketers are running content programs they consider mediocre or worse. (CMI)
-
55% cite creating content that actually resonates as their top challenge. Lack of resources (54%) is a close second. The quality problem outranks the quantity problem. (CMI)
-
86% of marketers plan to increase original research budgets. Proprietary data and surveys are increasingly seen as the strongest differentiator as AI-generated content floods the market. (CMI)
-
Original research produces 64% higher conversion rates and 61% stronger SEO performance. First-party data gives content a citation advantage that AI-generated articles cannot replicate. (CMI)
-
Differentiation now edges out efficiency as the top priority for 2026. Teams are shifting from “produce more” to “produce different.” This aligns with rising creative fatigue and the commoditization of standard content formats. (Our State of Creative Marketing in Tech report)
-
Customer outcomes and results are the most persuasive proof type at 42.7%. Yet 93% of teams have proof they cannot activate effectively. Only 38% have standardized their proof system. (Our State of Creative Marketing in Tech report)
For strategies on building a content plan that ties to business outcomes, see our guide to digital content strategy.
AI in Content Marketing Statistics
AI adoption among marketers is near-total. Governance, accuracy safeguards, and clear human oversight are not.
-
94% of marketers plan to use AI for content creation in 2026. This is up significantly from prior years and represents near-universal adoption. (HubSpot)
-
87% of marketers use generative AI in at least one workflow, up from 51% in 2024. The jump from half to nearly nine in ten happened in under two years. (Salesforce)
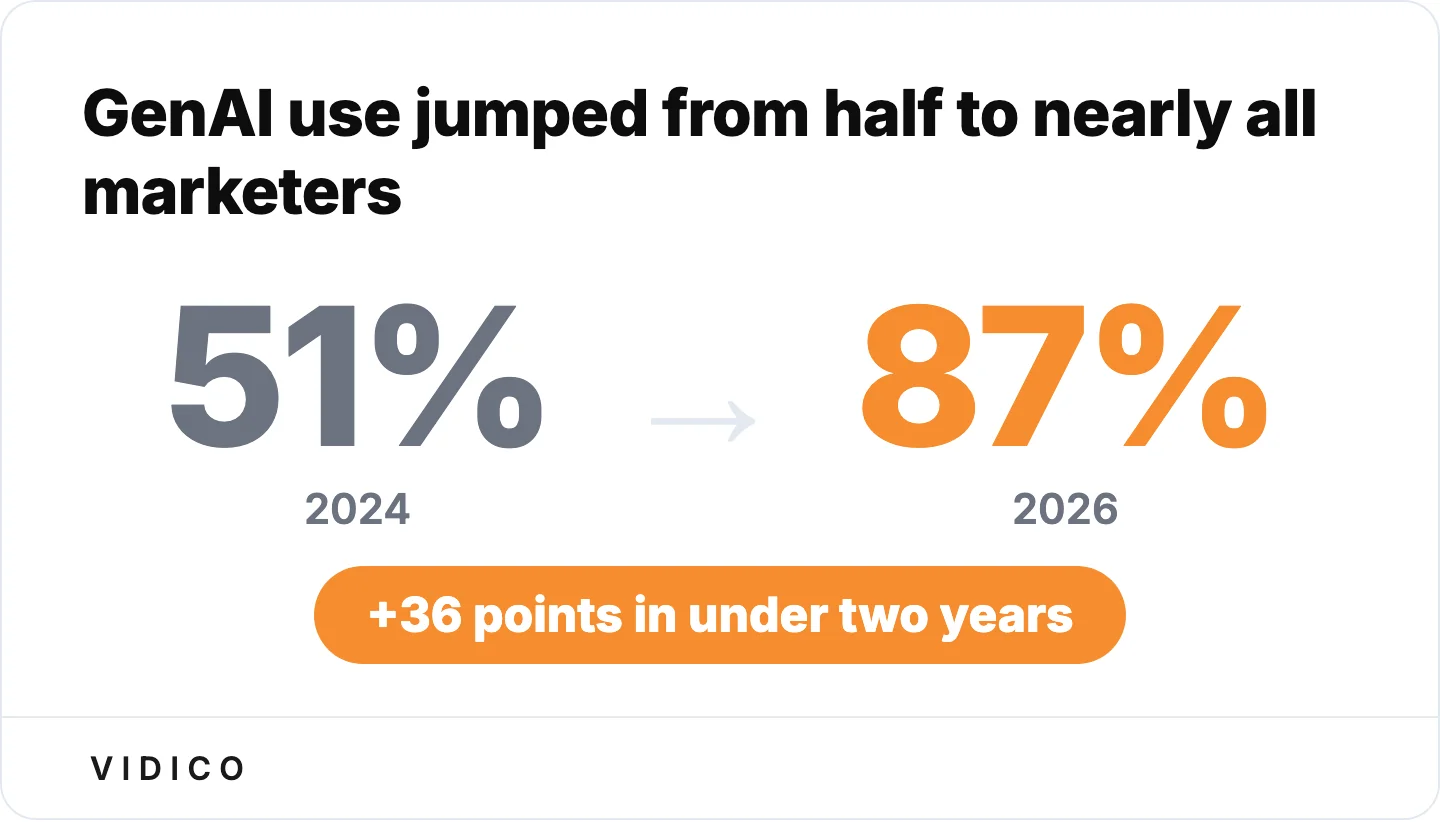

Generative AI use among marketers nearly doubled in under two years, from 51% in 2024 to 87% (Salesforce).
-
Non-AI blog content creation dropped from 65% to 5% in two years. Nearly all written content now involves AI at some stage of the process. (CMI)
-
63% of video marketers used AI tools in their workflow. AI adoption in video trails written content but is growing fast, with use cases in editing, subtitling, and repurposing. (Wyzowl)
-
AI content drafting delivers 3.2x ROI on average. Personalization engines deliver 2.7x ROI, putting AI to strongest use in the middle of the content process rather than at the start or finish. (McKinsey)
-
Marketers recover an average of 6.1 hours per week using AI tools. Most of those hours come from automating research, first drafts, and content repurposing. (McKinsey)
-
98% of marketers plan to increase their AI SEO spend in 2026. This includes tools for AI search optimization, content clustering, and programmatic SEO. (Neil Patel)
-
AI Overviews appear for 88% of informational searches. This changes the ROI calculus for informational content, as zero-click search reduces organic traffic for query types that AI can answer directly. (Semrush)
-
30% of marketers report decreased search traffic due to AI tools. The decline is concentrated on simple informational queries where AI Overviews provide a direct answer. (HubSpot)
-
AI works best mid-process, in editing and repurposing existing assets. The brief and final creative output stay human. Final copy is the output teams are most protective of. (Our State of Creative Marketing in Tech report)
-
Only 29% of teams have a formalized AI governance policy. Nearly half are still building one. Accuracy is the #1 risk concern. The gap between adoption speed and policy readiness is widening. (Our State of Creative Marketing in Tech report)
Download a free video script built by a creative team that uses AI for speed and humans for the brief.
Video Content Marketing Statistics
Video is the most adopted, most invested-in, and highest-return content format in 2026. No other format comes close on buyer influence.
-
91% of businesses use video as a marketing tool in 2026. This is the highest adoption rate ever recorded. (Wyzowl)
-
93% of marketers consider video an important part of their marketing strategy. Only 7% see it as a low priority. (Wyzowl)
-
82% say video marketing delivers strong ROI. This is consistent across company sizes and industries. (Wyzowl)
-
83% say video has directly increased sales. Conversion happens when video appears on landing pages, in email campaigns, and in paid social. (Wyzowl)
-
96% of people watch explainer videos to learn about a product or service. Explainer video is the most common video type consumed by buyers during the research phase. (Wyzowl)
-
85% of people say a video has influenced their buying decision. Video ranks above reviews, recommendations, and written content for purchase influence. (Wyzowl)
-
Short-form video is the most used content format by marketers. It generates the highest ROI of any single format, with 49% of marketers naming it their top-return format. (HubSpot)
-
Top 3 ROI-driving video formats: short-form (49%), long-form (29%), and live-streaming (25%). Short-form leads, but long-form and live content still outperform most non-video formats. (HubSpot)
-
Mid-form video is now the leading content format by a slim margin. In a survey of 230+ B2B tech marketing leaders, mid-form (typically 2-5 minutes) edged out both short-form and long-form for planned investment. (Our State of Creative Marketing in Tech report)
-
Paid social video and customer-proof video are tied as the highest-impact formats for 2026. Customer-proof (testimonials, case studies, results-driven content) is gaining ground as a top-funnel format. (Our State of Creative Marketing in Tech report)
-
YouTube is the most widely used video marketing platform at 82%. Facebook (69%), Instagram (65%), and LinkedIn (57%) round out the top four. (Wyzowl)
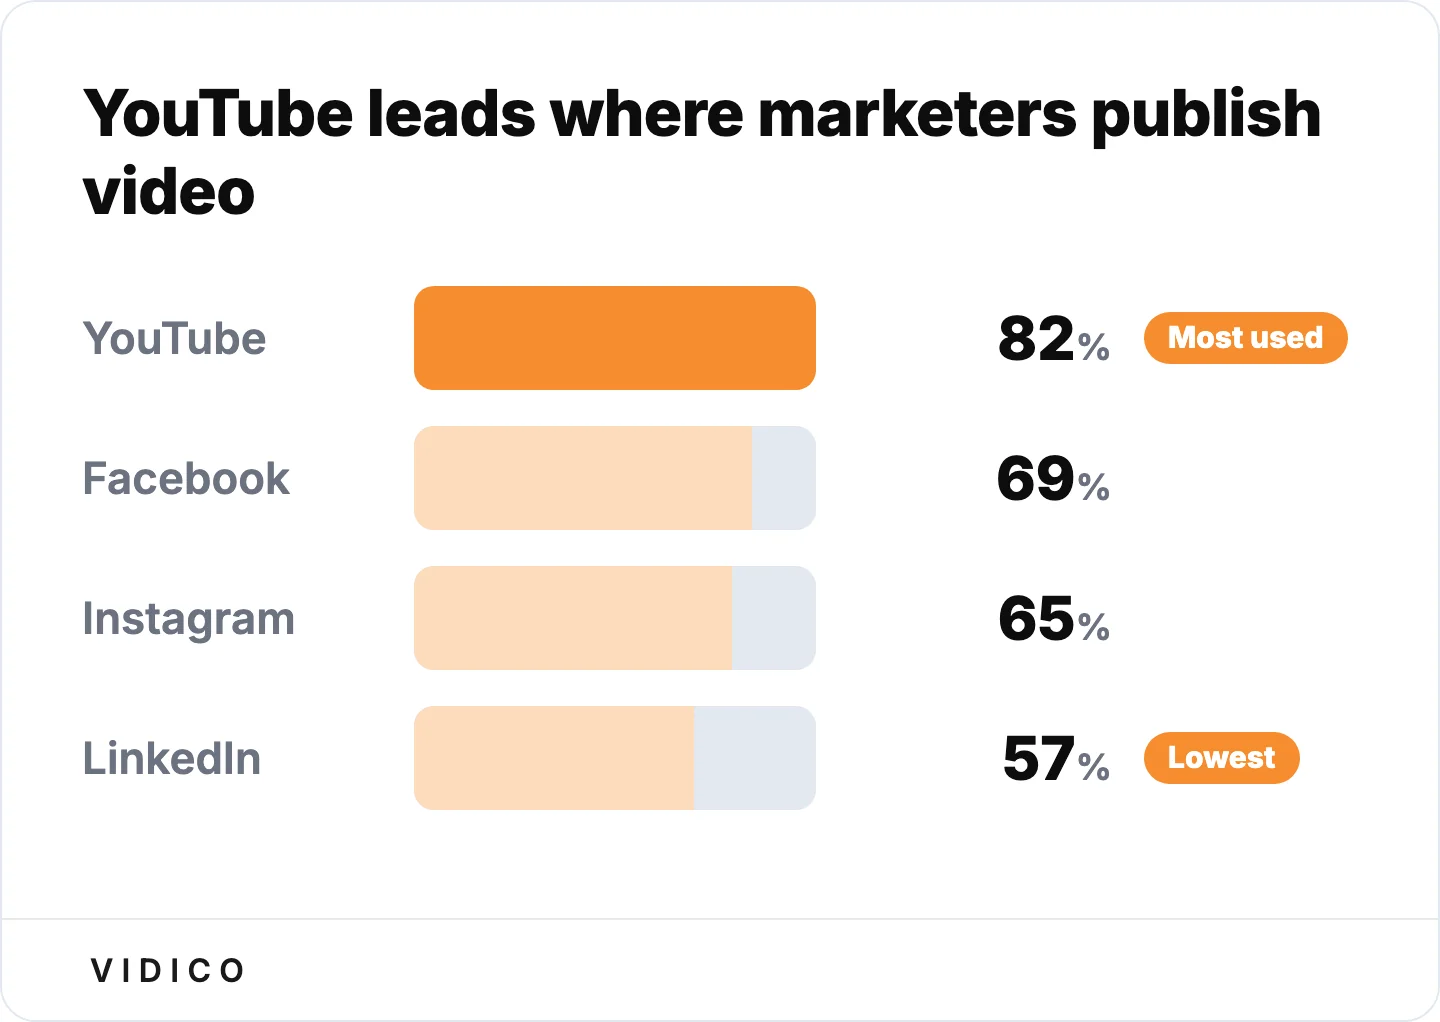

YouTube leads video marketing platforms at 82% usage, ahead of Facebook, Instagram, and LinkedIn (Wyzowl).
-
51% of marketers say 30-60 seconds is the optimal video length. Another 40% say under 2 minutes. Only 9% recommend videos longer than 2 minutes. (Wyzowl)
For deeper video-specific data, see our video marketing statistics and short-form video statistics roundups. We also published a breakdown of short-form vs. long-form video performance by platform.
Get a free Creative Intelligence Report analyzing your brand’s video and creative strategy against competitors. 48-hour delivery. Limited spots.
Blogging Statistics
Blogging remains a high-ROI format, but the average post is getting shorter, and visual content is becoming mandatory.
-
The average blog post is 1,333 words in 2025, down from 1,394 the prior year. The trend toward shorter posts reflects reader preferences and AI’s ability to handle longer research queries. (Orbit Media)
-
Blog posts (38%) are the third most popular content format behind video. Written content still generates traffic and leads, but it now competes with video and interactive formats for attention. (HubSpot)
-
Blog posts rank among the top 5 highest-ROI formats at 22.26%. Small businesses are 23% more likely than larger companies to see direct ROI from blog content. (HubSpot)
-
Websites that regularly publish blog posts see 430% more indexed pages. More indexed pages means more entry points from search and more long-tail keyword coverage. (DemandMetric)
-
How-to articles (76%) and listicles (54%) are the most popular blog formats. Long-form guides (39% publishing 2,000+ word posts) correlate with stronger reported results. (Orbit Media)
-
Blog posts with visuals have 650% higher engagement than text-only posts. Adding images, charts, and embedded video to written content increases time on page and shares. (Buffer)
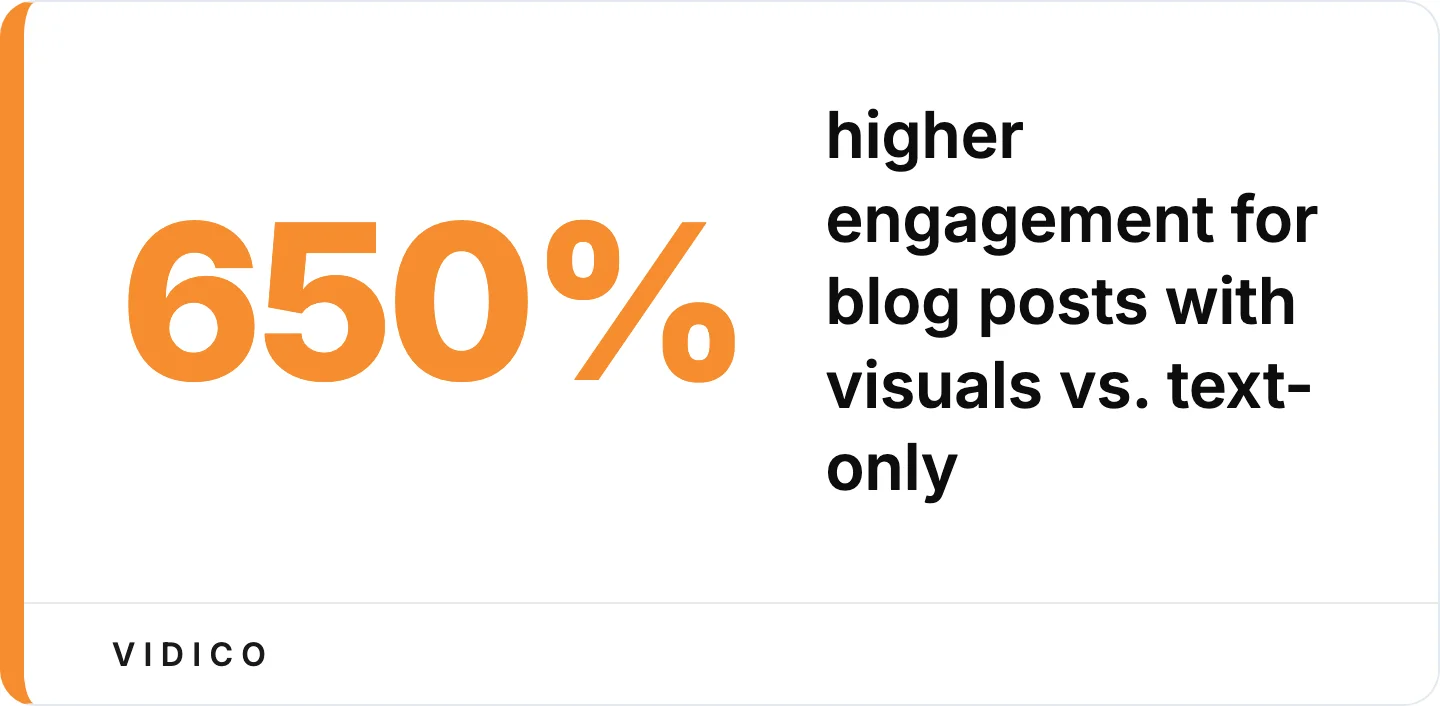
Adding visuals to a blog post lifts engagement 650% over text-only (Buffer).
B2B Content Marketing Statistics
B2B teams invest more heavily in content marketing than B2C, and their distribution channels look different. LinkedIn dominates, and production models are shifting toward hybrid structures.
-
Content marketing is part of 92% of B2B marketing strategies. B2B adoption outpaces the general marketing population by a wide margin. (CMI)
-
73% of B2B marketers have a documented content strategy. This is significantly higher than the general average of 47%. (CMI)
-
B2B content distribution channels: social media (90%), blogs (79%), email newsletters (73%). Social media is the widest reach channel, but email newsletters drive the highest per-subscriber engagement. (CMI)
| B2B Distribution Channel | Usage Rate |
|---|---|
| Social media | 90% |
| Blogs | 79% |
| Email newsletters | 73% |
-
68% of B2B marketers used LinkedIn more in 2025 than the prior year. LinkedIn is the top publishing channel for B2B thought leadership, with 76% of B2B marketers using it for this purpose. (CMI)
-
65% of B2B marketers increased their content marketing spend. Budget growth is driven by video production, AI tools, and original research. (CMI)
-
Nearly half of B2B teams run a hybrid production model, combining in-house and external partners. Pure in-house and pure outsourced models are both declining. (Our State of Creative Marketing in Tech report)
-
Most B2B teams take 4-14 days from concept to live content. Teams with reusable template systems hit 1-3 days. The gap between teams with and without production systems is 3-10x in speed. (Our State of Creative Marketing in Tech report)
For more B2B-specific data, see our B2B video marketing statistics and B2B video marketing guides.
B2C Content Marketing Statistics
B2C content marketing skews toward visual formats, personalization, and social-native distribution. Consumer brands invest differently than B2B teams, and the data reflects those differences.
-
B2C content marketing favors short-form video, images, and user-generated content over long-form written formats. Consumer audiences engage more with visual and social-native content than blog posts or whitepapers. (HubSpot)
-
71% of customers expect personalized content from the brands they interact with. Personalized CTAs outperform generic ones by 202%, and 80% of businesses report higher spending from customers who receive personalized experiences. (Salesforce)
-
56% of brands use AI to tailor customer interactions. AI-driven personalization increases conversions by 29% compared to static content. (Salesforce)
-
Instagram and TikTok are the top two video distribution platforms for B2C brands. Both platforms prioritize short-form video, and video posts generate the highest engagement rates across B2C content types. (Sprout Social)
Social Media and Content Distribution Statistics
Social media is the widest-reach content distribution channel. Video consumption dominates, and partnerships are overtaking paid social as a growth lever.
-
Social media users engage with an average of 6.83 platforms each month. Cross-platform distribution is now the default, not an add-on. (Sprout Social)
-
Video accounts for 60%+ of all social media content consumption. Text and image posts still exist, but video drives the majority of engagement and time on platform. (Buffer)
-
Instagram carousels achieve a 4.2% engagement rate. This makes carousels one of the highest-engagement static formats on any platform. (Sprout Social)
-
LinkedIn videos generate a 3.9% engagement rate. Video on LinkedIn outperforms text posts and image posts for B2B audiences. (Sprout Social)
-
Influencer marketing spending surpassed $10 billion in 2025, growing 15.7% in 2026. Influencer partnerships are now a standard budget line for B2C and increasingly for B2B. (eMarketer)
-
Partnerships are the top-cited growth channel for 2026, overtaking paid social for the first time. This includes co-marketing, distribution partnerships, and creator collaborations. (Our State of Creative Marketing in Tech report)
For platform-specific data, see our LinkedIn video statistics and video content for social media guides.
Build a free video marketing plan tailored to the platforms and formats your audience actually uses.
Email Marketing and Search Statistics
Email remains the highest-ROI distribution channel. Organic search is still the largest traffic source, but zero-click behavior is changing how teams plan content.
-
Email marketing converts at 2.8% for B2C and 2.4% for B2B. These conversion rates are higher than social media, paid search, and display advertising. (FirstPageSage)
-
Organic search accounts for 46.98% of all web traffic. Nearly half of all website visits still come from Google and other search engines. (Semrush)
-
60% of searches end without a click. Zero-click searches are rising as AI Overviews and featured snippets answer queries directly in the SERP. (Semrush)
-
SEO budgets are recovering: 61% of marketers are increasing spend, up from 44%. The decline in organic traffic from AI has not reduced investment. Instead, teams are spending more on content quality and AI search optimization. (Neil Patel)
-
Over 92% of marketers are optimizing content for both traditional and AI-powered search. AEO (answer engine optimization) is now a standard practice alongside traditional SEO. (HubSpot)
For email-specific tactics, see our guide on using video in email campaigns.
Creative Production and Workflow Statistics
These stats come from our State of Creative Marketing in Tech report, which surveyed 230+ B2B tech marketing leaders on how their teams produce, test, and ship creative work. This data is not available from any other source in this roundup.
-
Production capacity and internal approvals are the top two workflow bottlenecks. Budget ranks third. The actual slowdown is operational, not financial. (Our State of Creative Marketing in Tech report)
-
Budget is the single biggest constraint at 27.4%. Measurement and attribution (14.1%), slow approvals (13.2%), and bandwidth or headcount (12.8%) round out the top four. (Our State of Creative Marketing in Tech report)
| Constraint | % of Respondents |
|---|---|
| Budget | 27.4% |
| Measurement / Attribution | 14.1% |
| Slow Approvals | 13.2% |
| Bandwidth / Headcount | 12.8% |
-
Only 1 in 3 teams has a fully reusable asset system. Teams with reusable templates produce content in 1-3 days. Teams without take 4-14 days. (Our State of Creative Marketing in Tech report)
-
65% of teams run structured creative experimentation at least monthly. The most-tested variables are audience and segment (44.9%), message angle (39.3%), and hook or opening (38.0%). (Our State of Creative Marketing in Tech report)
-
The #1 barrier to better creative testing is the gap between media and creative teams. When the team running ads and the team making ads operate separately, testing cycles slow down and learnings get lost. (Our State of Creative Marketing in Tech report)
-
93% of teams have proof they cannot activate effectively. Only 6.8% say they lack enough proof. The problem is packaging and distribution, not creation. Only 38% have standardized their proof system. (Our State of Creative Marketing in Tech report)
Content Marketing Budget Statistics
Budget data sits at the intersection of confidence and constraint. Most teams are spending more, but where the money goes (and what gets cut first) tells a different story.
-
76% of B2B tech marketing leaders say their creative production budget is increasing this year. Another 74% say their total marketing budget is growing. (Our State of Creative Marketing in Tech report)
-
93% of marketers believe content marketing budgets will stay the same or increase in 2026. Very few teams are cutting content spend. The debate is about allocation, not investment. (CMI)
-
42.7% of teams allocate 21-35% of their total marketing budget to creative production. Another 35.9% allocate 10-20%. Most teams are putting between a fifth and a third of their budget into creative. (Our State of Creative Marketing in Tech report)
-
Brand campaigns (17.5%) and creative experimentation (17.1%) are the first budget lines cut. Always-on content volume is the most protected at 9.0% (least likely to be cut). When budgets tighten, ongoing content production survives while brand and innovation spend shrinks. (Our State of Creative Marketing in Tech report)
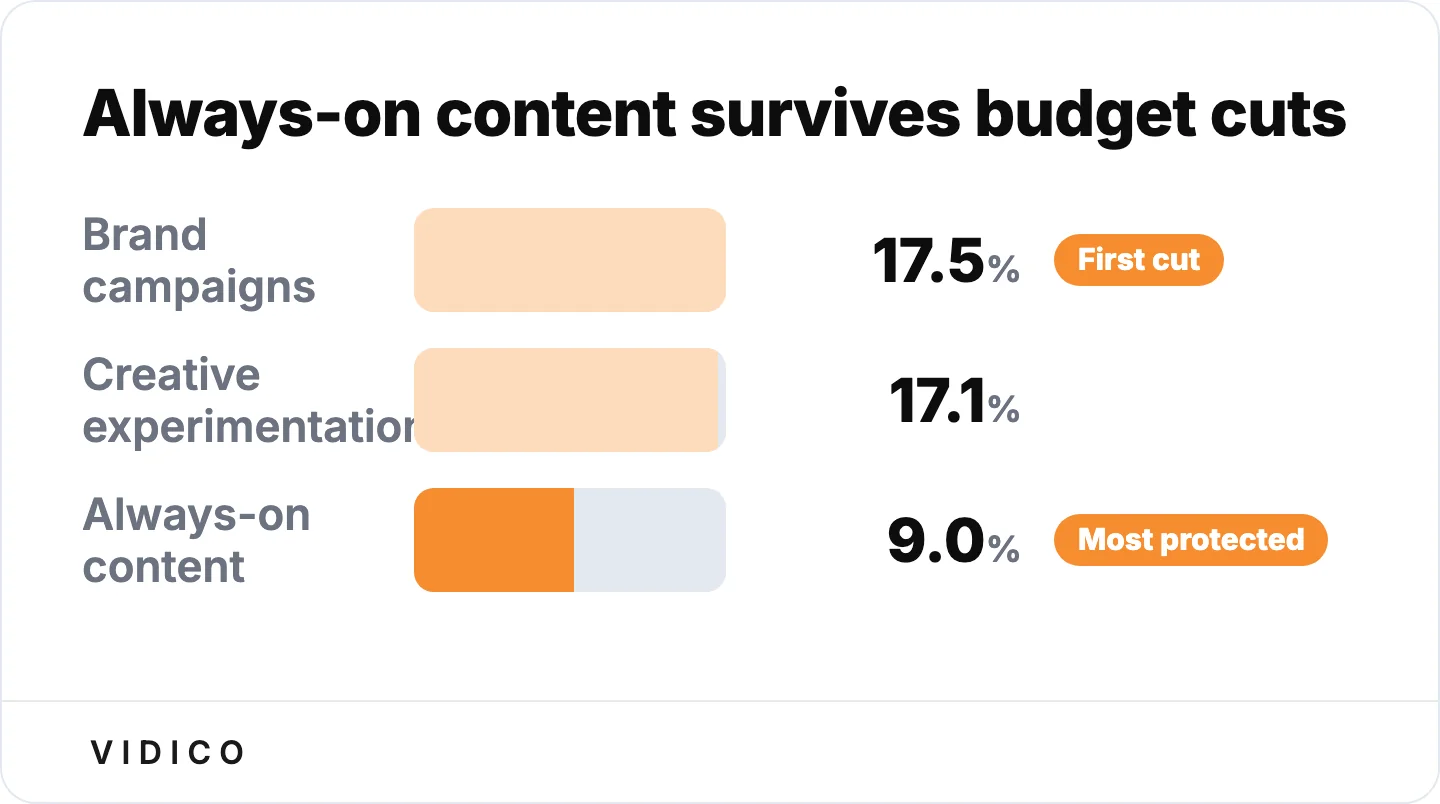

When budgets tighten, brand and experimentation spend gets cut first; always-on content volume is the most protected (Vidico State of Creative Marketing in Tech).
-
The average content marketing budget is 26% of total marketing spend. This has been growing steadily as video production, AI tooling, and original research all require increased investment. (CMI)
Podcast and Audio Content Statistics
Podcast listenership continues to grow, and ad spend is following. Audio content is a smaller slice of content marketing, but it commands unusual attention.
-
619.2 million people listen to podcasts globally in 2026, a 6.83% year-over-year increase. In the US alone, 158 million people are monthly listeners. (Edison Research)
-
55% of the US population aged 12+ listens to podcasts monthly. Podcast reach has more than doubled in the past decade. (Edison Research)
-
US podcast ad spend is above $3 billion in 2026. Host-read ads account for 55% of podcast ad revenue and outperform dynamically inserted ads on recall and conversion. (Edison Research)
-
81% of podcast listeners pay more attention to podcast ads than radio, TV, or social media ads. The intimacy and trust of the host-listener relationship drives higher ad receptiveness. (Edison Research)
Frequently Asked Questions
What percentage of businesses use content marketing?
97% of marketers include content marketing in their overall strategy, and 92% of B2B companies have it as part of their marketing plan. However, only 29% of marketers actively use content marketing as their primary channel.
What is the ROI of content marketing?
The average three-year ROI for content marketing is 844%. ROI breaks even around month 7 and exceeds 1,100% by month 36. Content marketing generates three times more leads than outbound marketing at 62% lower cost.
What percentage of marketers use AI for content?
94% of marketers plan to use AI for content creation in 2026, and 87% already use generative AI in at least one workflow. However, only 29% of teams have a formalized AI governance policy.
Final Thoughts
Content marketing delivers proven ROI across every industry and format. The three-year average return is 844%, and no other marketing discipline matches its cost efficiency at scale.
But the numbers also reveal where teams struggle. Most have a strategy. Few call it effective. AI is everywhere. Governance is not. Creative fatigue is accelerating, and the teams pulling ahead are the ones with reusable production systems and original research.
We surveyed 230+ B2B tech marketing leaders for our State of Creative Marketing in Tech report, benchmarking how teams handle creative production, budget allocation, AI adoption, and testing across the industry. We build reusable video production systems for B2B teams, and the report captures the operational data behind how those teams actually work.
The formats generating the highest returns right now are short-form video, mid-form video, customer-proof content, and original research. Teams that pair strong production systems with documented strategy and structured experimentation are pulling measurably ahead.
Book a free strategy session to see how your content production compares to the benchmarks above.
Sources
- Semrush: Content Marketing Statistics
- Statista: Content Marketing Revenue
- DemandMetric: Content Marketing Infographic
- HubSpot: Marketing Statistics
- HubSpot: State of Marketing
- Content Marketing Institute: B2B Content Marketing Trends Research
- FirstPageSage: Content Marketing ROI
- Salesforce: State of Marketing
- McKinsey: The State of AI
- Neil Patel: Marketing Budget Trends
- Orbit Media: Blogging Statistics
- Buffer: State of Social Media Engagement
- Sprout Social: Social Media Content Strategy Report
- eMarketer: Influencer Marketing Report
- Edison Research: The Infinite Dial