
Twitter, now X, has approximately 557 million accounts reachable through advertising as of late 2025, though the platform has not published an official user count since 2022. That gap matters: most Twitter statistics circulating online quote advertising reach as if it were a user number. Below are 50 statistics on X’s audience, demographics, engagement, video performance, and ad revenue, each traced to the source that actually measured it.
Key Takeaways
- X has published no official global user figure since October 2022. The last audited number was 237.8 million monetizable daily active users, filed with the SEC in Q2 2022. Everything quoted since is advertising reach, an outside model, or a company statement.
- The user counts quoted on most statistics pages are advertising reach, not users. Ad reach counts targetable accounts, including duplicates, bots, and brand accounts. The organisation that publishes it says plainly that it is not a proxy for user numbers. Some widely-circulated figures, including the 611 million count, trace to no identifiable source at all.
- X’s audience in the United States has been flat, not collapsing. Pew Research Center puts X usage at 21% of U.S. adults, unchanged year over year and down from 23% in 2021.
- Average impressions per post are falling. A measured sample of over 1.1 million posts found 2,711 average impressions in 2025, down from 2,864 the year before.
- Video is the format the platform pushes hardest. X reported 8 billion daily video views, and its feed is now ranked by Grok, xAI’s model, which favours contextual relevance over keyword and hashtag signals.
Content
What X Actually Publishes About Its Own Users
X does not publish a global monthly active user figure, and has not done so since it went private in October 2022. This single fact explains why almost every “Twitter statistics” page you will read quotes a different number.
There are four distinct figures in circulation, and they measure four different things.
| Figure | What it measures | Source | As of |
|---|---|---|---|
| 237.8M monetizable daily active users | Logged-in or authenticated accounts, audited | SEC Form 10-Q | Q2 2022 |
| 102.0M monthly active recipients, EU only | First-party count, legally required | X DSA Transparency Report | Apr to Jun 2025 |
| 126.2M mobile daily active users | Independently measured panel | Similarweb, reported by Forbes | Jan 2026 |
| 557M potential advertising reach | Targetable accounts, includes duplicates and bots | Kepios and DataReportal | Oct 2025 |
1. The last official figure X published was 237.8 million average monetizable daily active users. That number appears in Twitter’s final quarterly filing with the U.S. Securities and Exchange Commission, covering the three months ended June 30, 2022, split into 41.5 million in the United States and 196.3 million elsewhere.
2. X defined a monetizable daily active user as an account that logged in or was otherwise authenticated and accessed the platform on a given day. The same filing estimated that false or spam accounts represented fewer than 5% of that total.
3. The only current first-party user data X publishes covers the European Union, where disclosure is legally required. X’s transparency reporting puts average monthly active recipients across the 27 EU member states at 102,004,250 for April to June 2025.
4. X’s disclosed EU audience splits into 76,001,687 logged-in recipients and 26,002,558 logged-out recipients. The logged-out quarter is a reminder that a large share of what looks like platform traffic never signs in.
5. Advertising reach is not a user count, and the organisation that publishes it says so directly. DataReportal states that advertising reach figures are not a direct proxy for a platform’s overall user base and may include duplicate accounts, inauthentic accounts, and non-human accounts belonging to businesses, brands, and pets.
6. The most-quoted global user number is a model, not a measurement. Statista’s worldwide X user series carries its own methodology note that all values are estimates, derived from penetration research and a top-down attribution of regional aggregates by traffic share.
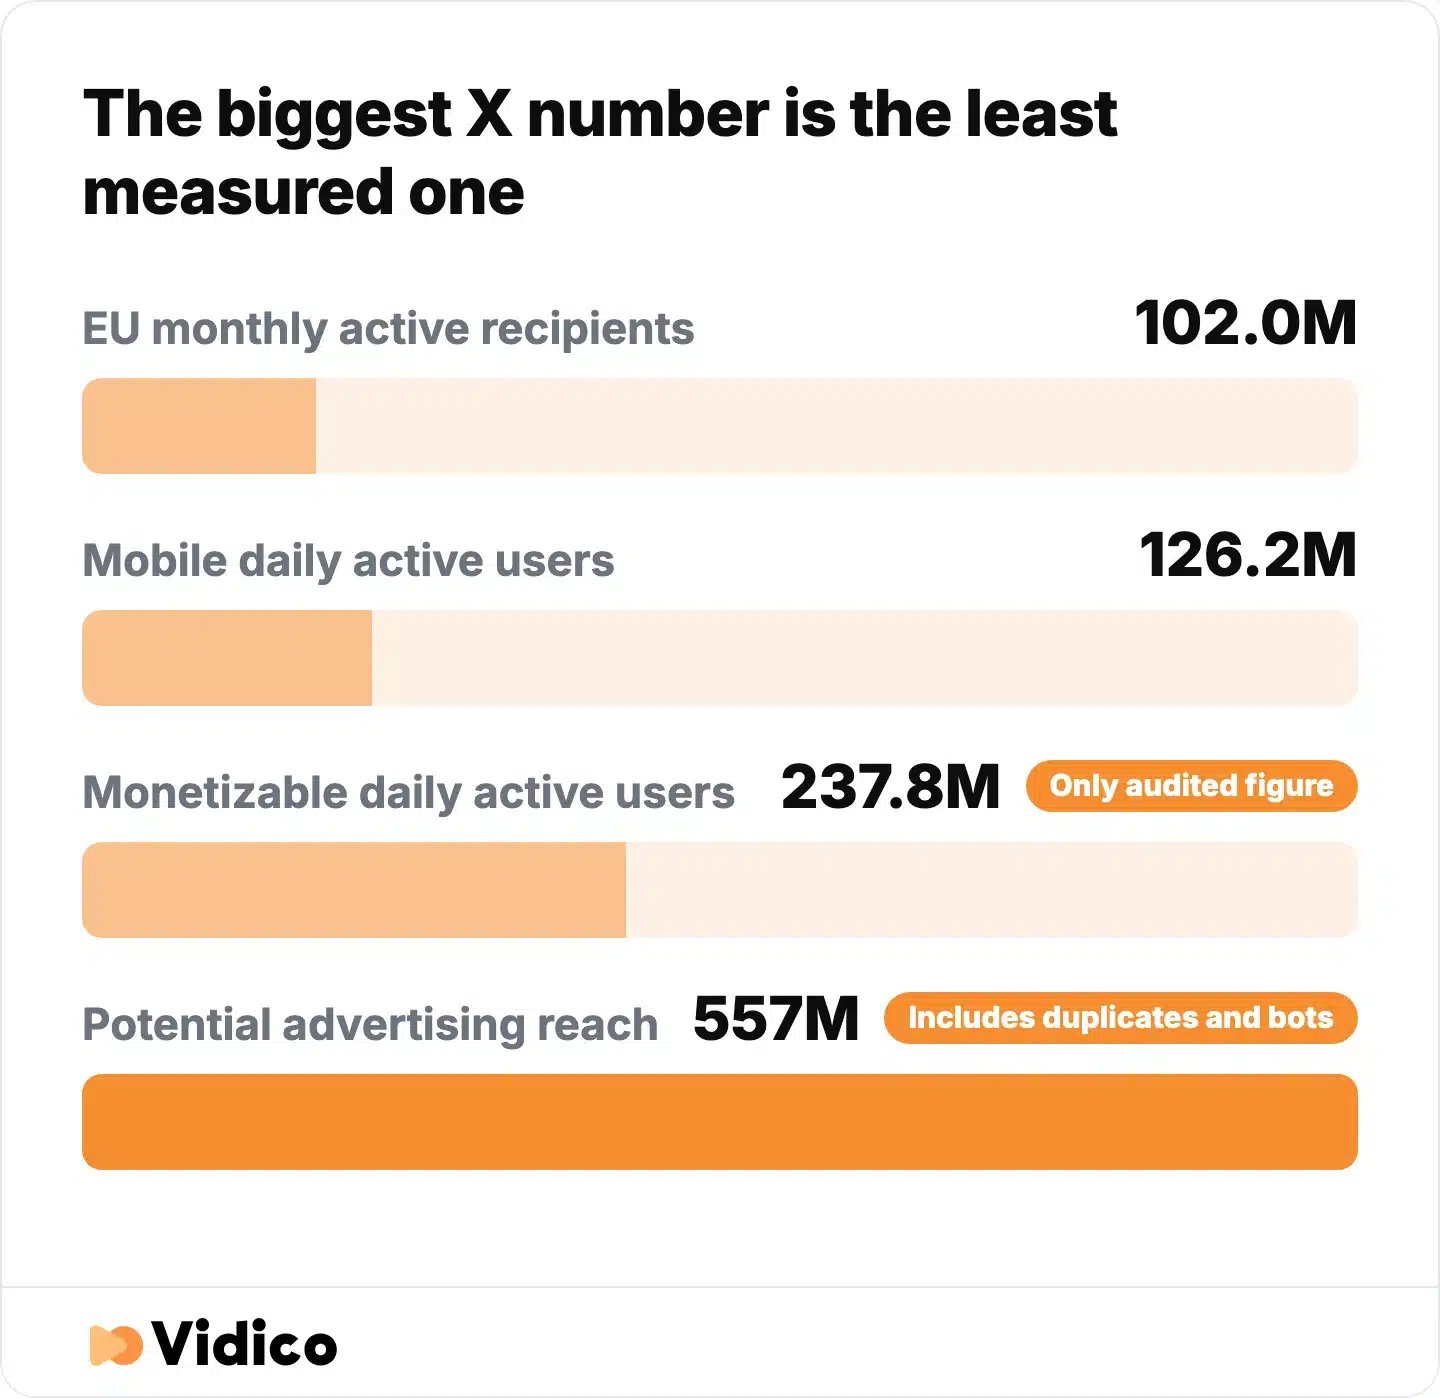
The four numbers quoted as “X users” measure four different things, and only the 237.8M figure was ever audited. Sources: SEC Form 10-Q, X DSA Transparency Report, Similarweb via Forbes, Kepios and DataReportal.
Twitter (X) Audience Size Statistics
7. X ads reached approximately 557 million accounts as of October 2025. DataReportal’s tracking recorded 586 million in January 2025, a decline of roughly 5% year over year.
8. Around 529 million of X’s advertising audience is aged 18 and over. The gap between the 557 million total and the adult figure reflects both under-18 accounts and the imprecision built into ad-platform estimates.
9. Independent measurement put X at 126.2 million daily active users on mobile in January 2026. Similarweb’s panel data, reported by Forbes, recorded an 11.9% decline year over year across the first 13 days of the month.
10. Threads overtook X on mobile daily active users, reaching 143.2 million in January 2026 against X’s 126.2 million. Note that some published statistics pages misattribute the Threads figure to X. The two are separate measurements from the same panel.
11. X.com ranks as the 5th most-visited website in the world. Similarweb places it 5th globally and 7th in the United States as of June 2026, with 4.4 billion visits over a rolling three-month window.
12. Visits to x.com grew 4.66% month over month as of June 2026. Web traffic and app usage are moving in different directions, which is why measured web visits and measured mobile daily actives appear to contradict each other. They are different metrics, gathered from different panels, at different dates.
13. France is X’s largest single market in the European Union, with 18,401,541 average monthly active recipients. Spain follows at 16,684,695 and Germany at 14,929,142, according to X’s own disclosure. These are among the few national user counts X still publishes anywhere.
14. X said its users posted more than 500 million times per day. This figure was stated by X’s then-CEO in October 2023 and reported by TechCrunch. It has not been updated or independently audited since, so treat it as a dated company claim rather than a current measurement.
15. X’s 500 million daily posts break down as roughly 100 million original posts, 100 million replies, and 300 million quotes and reposts. Original content is a minority of platform activity by a factor of four.
16. X reported approximately 100 billion daily impressions. This came from the same October 2023 remarks, and carries the same caveat: it is a company statement, not an audited or externally verified number.
17. The “500 million posts per day” claim traces back to a Twitter engineering post published in 2013. The original engineering post has circulated for over a decade with minimal revision, which is worth knowing before citing it as current.
Twitter (X) User Demographics Statistics
X’s U.S. audience, measured by Pew Research Center against all U.S. adults:
| Segment | Share who use X |
|---|---|
| Adults 18 to 29 | 33% |
| Adults 30 to 49 | 25% |
| Adults 50 to 64 | 16% |
| Adults 65 and over | 10% |
| Men | 25% |
| Women | 16% |
| Asian adults | 32% |
| Black adults | 26% |
| Hispanic adults | 23% |
| White adults | 18% |
| All U.S. adults | 21% |
18. 21% of U.S. adults say they ever use X. Pew Research Center’s survey, fielded through June 2025, is the most reliable read on American usage available.
19. U.S. usage has been flat, not collapsing. Pew’s time series shows 23% in 2021, 22% in 2023, 21% in 2024, and 21% in 2025. The decline is real but gradual, and it stopped moving between the last two readings.
20. 33% of U.S. adults aged 18 to 29 use X, the highest of any age group. Usage falls steadily with age across Pew’s sample.
21. 25% of U.S. adults aged 30 to 49 use X. This group holds the most purchasing authority in most B2B buying committees.
22. 16% of U.S. adults aged 50 to 64 use X. Adoption roughly halves between the youngest and this cohort.
23. 10% of U.S. adults aged 65 and over use X. X skews younger than Facebook and older than TikTok.
24. American men use X at a higher rate than women, 25% versus 16%. Pew’s gender gap on X is wider than on most other major platforms.
25. 32% of Asian American adults use X, the highest usage of any racial or ethnic group Pew measures. Black adults follow at 26%, Hispanic adults at 23%, and White adults at 18%.
26. X’s advertising audience skews roughly 64% male. This measures the ad-targetable audience rather than verified individuals, so treat it as directional.
27. TikTok reaches more U.S. adults than X, 37% versus 21%. Both figures come from the same Pew survey, which makes this one of the few genuinely like-for-like platform comparisons available.
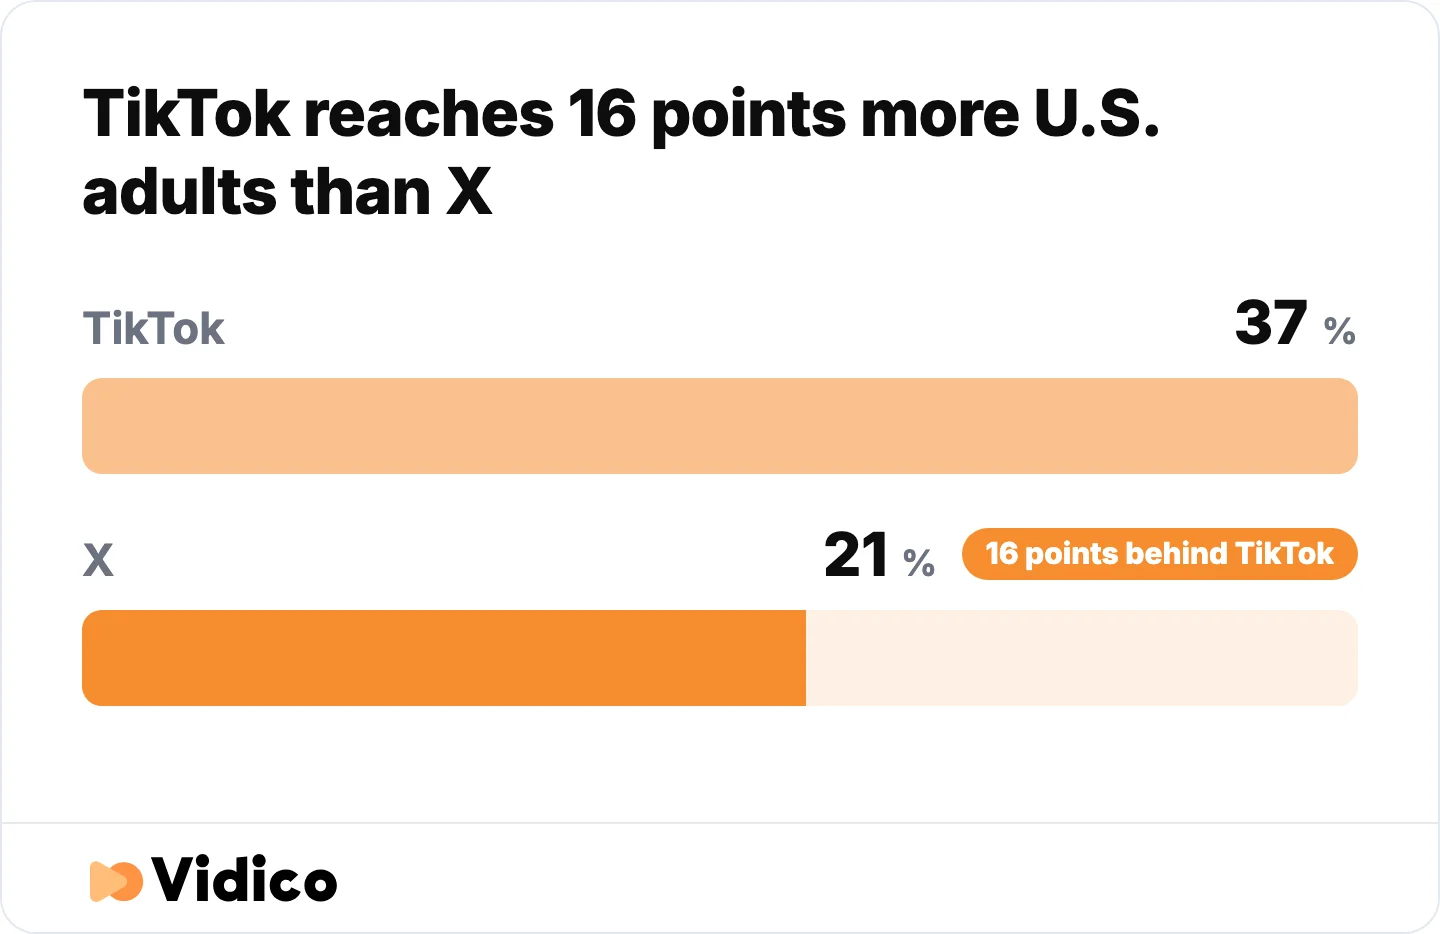
Measured in the same survey, TikTok reaches 16 percentage points more U.S. adults than X. Source: Pew Research Center.
28. Poland, Italy, and the Netherlands form X’s next tier of EU markets, at 8.8 million, 8.3 million, and 8.2 million monthly active recipients. Together with France, Spain, and Germany, six countries account for the majority of X’s disclosed EU audience.
29. X users spend approximately 28 minutes per day on the platform. DataReportal’s global reporting places this below the major video-first platforms.
Twitter (X) Usage and Engagement Statistics
30. The average X post received 2,711 impressions in 2025. Statista measured this across 15,116 accounts and 1,123,528 posts, which makes it one of the few engagement figures on this page built from a real sample rather than a model.
31. Average impressions per X post fell from 2,864 in 2024 to 2,711 in 2025. Reach per post is contracting year over year, which contradicts the widely-repeated claim that organic reach on X is expanding.
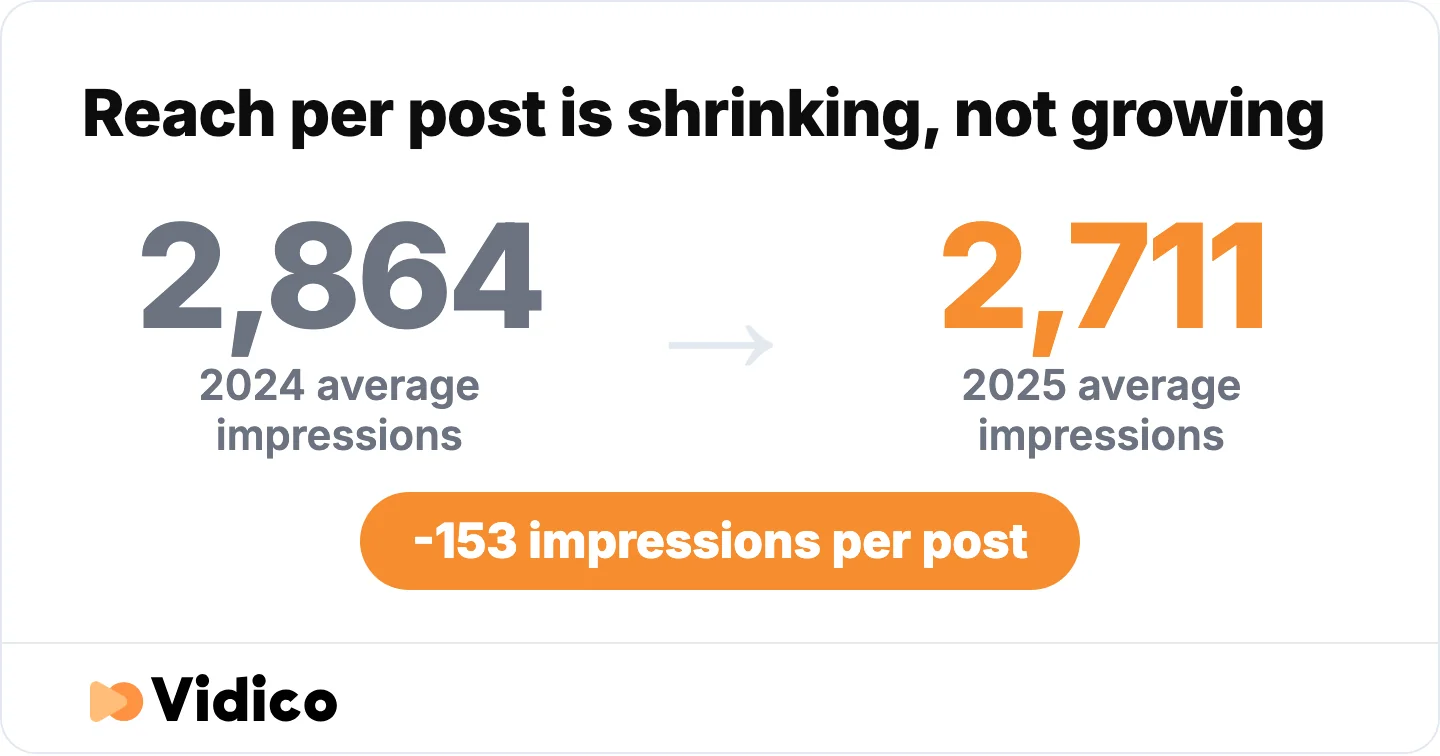
Reach per post is contracting, which contradicts the claim that organic reach on X is expanding. Source: Statista, measured across 1,123,528 posts.
Median engagement rate on X by industry, from RivalIQ’s benchmark reporting:
| Industry | Median engagement rate |
|---|---|
| Sports teams | 0.073% |
| Higher education | 0.036% |
| Financial services | 0.025% |
| All industries | 0.015% |
32. The median engagement rate across industries is approximately 0.015%. RivalIQ’s benchmark reporting puts X well below Instagram and TikTok on engagement rate.
33. Sports teams record the strongest median engagement rate among the industries RivalIQ reports, at 0.073%. Real-time events are the platform’s strongest native use case, and the benchmark data reflects it.
34. Higher education accounts average a 0.036% median engagement rate. That is more than double the all-industry median of 0.015%.
35. Financial services accounts average a 0.025% median engagement rate. Regulated industries perform better on X than the cross-industry median, likely because their audiences are news-driven.
36. 57% of X users regularly get news on the platform. Pew’s news reporting, fielded in August 2025, puts TikTok’s equivalent figure at 55%. Measured against their own user bases, the two platforms are close.
37. Only 12% of all U.S. adults regularly get news on X, against 57% of X’s own users. That contrast is the whole story: X is news-dense for the people who use it and largely irrelevant to everyone else.
38. Measured across all U.S. adults rather than platform users, X ranks last among the major platforms for news at 12%. Pew puts Facebook at 38%, YouTube at 35%, and Instagram and TikTok tied at 20%. X is news-dense among its own users and small in absolute terms.
39. Around 59.7% of X users globally say news is a primary reason they use the platform. DataReportal’s global reporting is directionally consistent with Pew’s U.S. finding.
Twitter (X) Content, Video, and Algorithm Statistics
40. X reported 8 billion daily video views. The figure came from an advertiser newsletter in May 2024, reported by Digiday, as part of the platform’s push to position itself as video-first.
41. X counts a video view after two seconds with at least 50% of the player in view, and only for logged-in users. This definition matters. A “view” on X is not comparable to a view on YouTube, and the threshold is at the permissive end of industry practice.
42. Grok has roughly 62 million monthly active users on mobile, and grok.com draws approximately 43.7 million unique monthly visitors. DataReportal’s tracking recorded both figures as of February 2026. Grok matters to publishers on X because it now ranks the feed.
Twitter (X) Advertising and Revenue Statistics
X’s advertising revenue against its pre-acquisition baseline:
| Period | Ad revenue | Note |
|---|---|---|
| Before acquisition | ~$4.5B | Peak, as a public company |
| 2024 | $1.94B | eMarketer estimate |
| 2025 | $2.26B | eMarketer projection, first rise since the sale |
43. X generated approximately $1.94 billion in advertising revenue in 2024. This is eMarketer’s estimate and sits far below the roughly $4.5 billion the company recorded before its acquisition.
44. Ad revenue was projected to reach $2.26 billion in 2025. That would represent the first year-over-year increase since the platform changed ownership.
45. X was acquired for $44 billion in 2022. Every revenue figure since should be read against that purchase price.

X sold for $44 billion and generated an estimated $1.94 billion in ad revenue in 2024. Read every revenue figure against the purchase price. Sources: eMarketer.
46. Advertising reach declined roughly 5.3% year over year through 2025. The targetable audience contracted alongside the revenue recovery, meaning revenue growth came from pricing and advertiser return rather than audience growth.
47. There is no audited public revenue figure for X. The company has been private since 2022 and files no quarterly reports, so every revenue number in circulation is an outside estimate.
48. Among B2B marketers, LinkedIn is the dominant thought-leadership channel at 76%. Content Marketing Institute’s survey of 1,015 B2B marketers, fielded from June to August 2025, puts email newsletters second at 54% and speaking events or webinars third at 52%.
49. The widely-repeated claim that “82% of B2B marketers use X” could not be traced to a primary source. The figure circulates across aggregator sites without an identifiable original study behind it. It appeared on the previous version of this page and has been removed rather than repeated.
50. X’s advertising reach in the United States is approximately 104 million accounts. That is ad-tool reach rather than people, and it sits well above Pew’s survey-based finding that 21% of U.S. adults use the platform. The gap between those two numbers, in a single well-measured market, is the clearest illustration of why reach and users should never be used interchangeably.
How Grok and xAI Changed the Feed
X is moving its feed algorithm to Grok, xAI’s model, replacing the heuristic and machine-learning recommendation system that ranked content previously. Elon Musk described the goal as the “deletion of all heuristics,” as reported by Social Media Today, with the model reading every post and watching every video to match content to users.
The practical consequence for anyone publishing on X is that distribution now runs on semantic understanding rather than keyword and hashtag matching. Content that is contextually relevant to a user’s interests can surface without the engagement signals that previously gated reach. Hashtag stuffing and engagement bait carry less weight under this model.

X is replacing its heuristic and machine-learning feed with Grok, so distribution now runs on semantic understanding rather than keyword and hashtag matching. Source: Social Media Today.
Grok has also become a significant product in its own right, at roughly 62 million monthly active users on mobile as of early 2026. The model ranking the feed is the same one millions of people now query directly.
What the Data Means for B2B and Tech Marketers
Read together, these numbers describe a smaller, denser platform rather than a dying one. Audience reach is contracting and impressions per post are falling, but the people who remain are news-driven, skew toward working-age professionals, and consume information at a rate no other platform matches relative to its size.
That combination suits a specific kind of content. Real-time commentary, product news, and expertise perform better than polished brand campaigns, because the platform’s native behaviour is reading and reacting rather than browsing. The engagement benchmarks reinforce it: the categories that outperform on X are the ones tied to events and news cycles.
The video picture is the one worth acting on. X has pushed hard toward video and reports its highest usage numbers there, while impressions per text post decline. For teams already producing video for LinkedIn or short-form channels, X is a low-cost distribution surface rather than a separate production commitment.
We publish our own research on how B2B tech teams are allocating creative budget in our 2026 State of Creative in Tech report, which covers where production capacity actually goes and what teams protect when budgets tighten.
If you want to see how your creative compares against competitors in your category, our Creative Intelligence Report is a free competitive analysis delivered within 48 hours.
Turning that shift into results usually means leaning on social media video production built for X’s short, sound-off-first feed.
Frequently Asked Questions
Is Twitter growing or declining?
X is declining slowly, and the rate depends on which metric you use. In the United States, Pew Research Center puts usage at 21% of adults, flat year over year and down from 23% in 2021. Globally, independently measured mobile daily active users fell 11.9% year over year to 126.2 million in January 2026. Web traffic tells a different story: visits to x.com grew 4.66% month over month as of June 2026. These are separate metrics from separate panels at separate dates, so they qualify each other rather than cancel out.
How many people have left Twitter since Elon Musk bought it?
There is no honest single answer, because X stopped publishing the metric that would let anyone calculate it. The last audited figure was 237.8 million monetizable daily active users in Q2 2022, filed with the SEC before the acquisition closed. The nearest current independent measurement is 126.2 million mobile daily active users in January 2026. These count different things, so the difference between them is not a departure figure. The only true like-for-like first-party series X still publishes is its EU disclosure, which recorded 102.0 million monthly active recipients for April to June 2025.
Does Twitter publish its own statistics?
Partly. X publishes advertising reach through its ad tools and legally mandated user counts for the European Union through its transparency reporting. It stopped publishing global monthly and daily active user figures after its final SEC filing in 2022. Everything else quoted as an X user statistic comes from outside estimates or company statements.
How many users does X have?
X has not published a global user figure since 2022. The last audited number was 237.8 million monetizable daily active users in Q2 2022. Currently, its advertising tools indicate approximately 557 million reachable accounts, but advertising reach counts targetable accounts rather than people and includes duplicates and non-human accounts.
Is TikTok bigger than Twitter?
Yes, on the measurement with the clearest methodology. Pew Research Center puts TikTok at 37% of U.S. adults against X at 21%. The two are much closer on news intensity within their own user bases, where Pew records 57% for X users and 55% for TikTok users.
What is a good engagement rate on X?
The cross-industry median engagement rate on X is approximately 0.015%, according to RivalIQ’s benchmark reporting. Performance varies sharply by category: sports teams reach a 0.073% median, higher education 0.036%, and financial services 0.025%. An account clearing 0.073%, the sports-team median, is performing at the top of RivalIQ’s measured range.
What is the most-used social media platform?
Facebook remains the largest by both global user base and social news reach in the United States, where 38% of adults regularly get news there. X does not lead on any headline usage measure.
Final Thoughts
The headline number quoted on most Twitter statistics pages is not a user count. X stopped publishing global user figures in 2022. The large figures that fill most statistics pages are advertising reach, which counts targetable accounts including duplicates, automated accounts, and brand accounts, and some of them trace to no source at all. Once you separate what was measured from what was modelled, the platform’s actual position becomes clear: a contracting but news-dense audience of working-age professionals, with reach per post declining and video as the format the platform is actively promoting.
For B2B and tech teams, that argues for treating X as a distribution channel for content produced for other platforms, rather than a destination worth its own production budget. The engagement benchmarks and impression trends do not support building a programme around it. They do support putting existing video in front of an audience that is cheap to reach.
At Vidico, we produce B2B explainer and social video for SaaS and tech brands, including the YouTube campaign for Hiver that generated over 20 million impressions, 80+ leads, and a 5.5% engagement rate. If you are deciding where video should run next, book a free strategy session and we will map it against your channel mix.
Sources
- Pew Research Center: Social Media Fact Sheet
- Pew Research Center: Social Media and News Fact Sheet
- U.S. Securities and Exchange Commission: Twitter Inc. Form 10-Q
- X Transparency: DSA Transparency Report
- DataReportal: Essential X Stats
- DataReportal: Digital Global Overview Report
- Statista: Average Impressions on X Posts
- Statista: X Users Worldwide
- Similarweb: x.com Traffic Analytics
- Forbes: Threads Widens Lead Over X
- TechCrunch: X Sees 500M Posts Per Day
- Digiday: X Boasts 8 Billion Daily Video Views
- eMarketer: X Ad Revenue Turnaround
- RivalIQ: Social Media Industry Benchmark Report
- Social Media Today: X Switching to Grok-Powered Algorithm
- Content Marketing Institute: B2B Content and Marketing Trends
- X Engineering Blog: New Tweets Per Second Record