
An animated infographic turns data into motion so the viewer’s eye is led to the point instead of hunting for it across a static page. The best ones come in three forms: a motion-graphics video, a short animated GIF loop, or an interactive web piece that lets the reader explore the information. Video and GIF motion set a sequence; interactive pieces let the reader choose the pace. Each format needs a clear visual hierarchy.
Below are 5 animated and interactive infographic examples worth studying, grouped by those three formats, with the one creative lesson each teaches. We’re Vidico, a motion-graphics and animated-infographic production team for B2B and SaaS brands with 2,000+ campaigns behind us, so a few of our own projects appear alongside strong work from other brands. After the gallery, we break down what makes the motion actually work and how to make one yourself.
Key Takeaways
- Three formats to consider: a motion-graphics video, an animated GIF loop, or an interactive web piece. Pick the format based on where the piece will live, not the other way around.
- Motion’s real job is attention, not decoration. A good animated infographic decides what matters and reveals it in order, so the viewer never has to search the frame for the point.
- The count-up is the signature move. A number that climbs from zero reads as an achievement. Bars that grow and rows that arrive one at a time carry the eye between figures.
- Lead with one hero stat, then support it with three to five. More than that and none of them land.
- Animated production costs more than static design, so it earns its budget when the data is the story: a launch, a report, a paid campaign.
Content
What Is an Animated Infographic?
An animated infographic is a data visualization that uses movement to explain a statistic, a process, or a trend. Instead of showing every number at once like a static graphic, it sequences the information so attention lands on one point at a time. For broader industry context, the global animation market is projected to rise from $492.14 billion in 2026 to roughly $953.31 billion by 2035, according to Precedence Research.
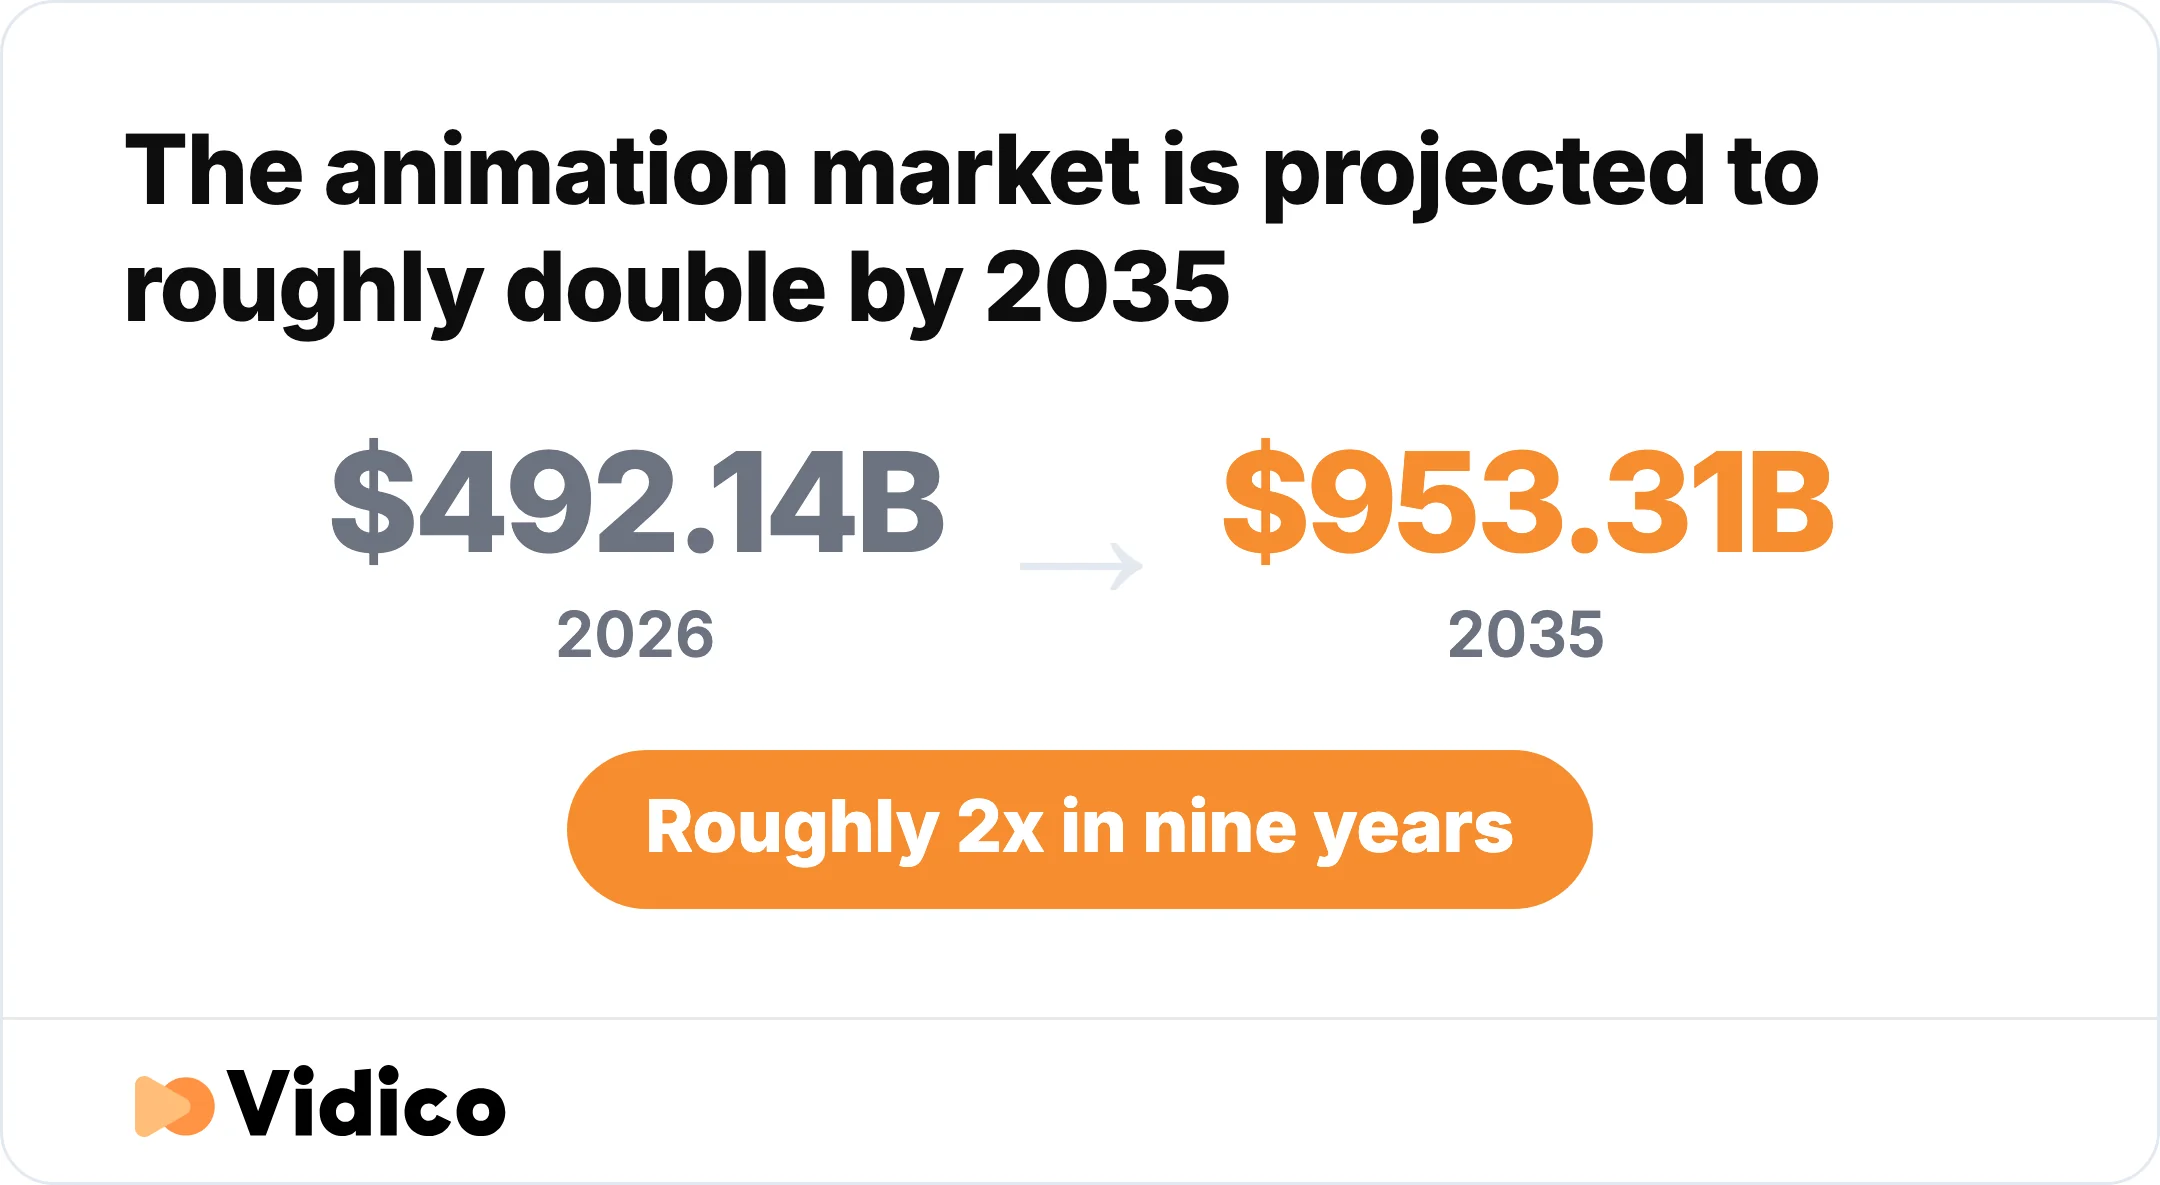
A forecast for the global animation industry, rather than animated infographics alone. Source: Precedence Research.
Animated infographics come in three main types:
- Motion-graphics video infographic. A full video that combines voiceover, kinetic typography, and animated data. Best for B2B explainers, product launches, and paid social, where you have a viewer’s full attention for 30 to 90 seconds. Motion graphics are a style of animation focused on design elements like logos, data visualizations, and text rather than characters.
- Animated GIF infographic. A silent, looping graphic that can highlight a statistic or show movement within a longer process diagram. Best for email, social feeds, blog posts, and slide decks, where it has to make its point in a few seconds with no sound.
- Interactive infographic. A web-based piece where the reader scrolls or clicks through connected data panels. Best for annual reports, research pages, and landing pages, where the reader is willing to engage and you want them to spend time.
This is a different format from general motion graphics examples, which cover everything from brand animations to UI demos. An animated infographic is specifically about making data legible. It is one tool in a wider motion-graphics toolkit, aimed squarely at data.
5 Animated and Interactive Infographic Examples to Inspire Your Next Project
These 5 examples run from polished B2B motion-graphics videos to playful GIF loops and scroll-driven interactive reports. We’ve grouped them by format so you can see how the same principle, using motion to direct attention, plays out at different lengths and levels of effort.
1. Josys Feature-Demo System (Motion-Graphics Video)
Josys is our clearest example of information design in motion. Instead of one long explainer, we built a motion system that powers eight short feature demos for the IT and SaaS management platform. The system uses reusable frame layouts that keep every data point structured and scannable, plus custom animated transitions that guide attention and cut the mental effort of following a dense interface.
The lesson: structure the layout first, then let animation move the reader through it. When the frames are consistent, the motion carries meaning instead of noise, and one design system can produce a whole series without starting from scratch each time.
2. Easy Agile SaaS Motion Graphics (Motion-Graphics Video)
Easy Agile shows what happens when a SaaS workflow is turned into a clean animated sequence rather than a screen recording. Colored geometric shapes move between short statements about collaboration, then give way to a grid of product-interface cards for sprint planning, story mapping, and other tasks. Vidico’s case study reports a Gold MUSE Award in 2022 and four times the industry-average click-through rate.
The lesson: animation is at its strongest when it simplifies, not when it adds detail. Stripping a workflow down to its essential moves makes the product easier to understand and the ad easier to click.
3. BigRentz: How Are Subways Built (Animated GIF)
BigRentz, an equipment rental company, uses a tall, looping animated infographic with sections for cut-and-cover tunneling, deep boring, tracks, ventilation, and underground obstacles. Static labels explain each stage while small animated cross-sections show equipment and trains moving. The sections remain visible together rather than appearing as a narrated video sequence.
The lesson: animation is the right tool for any process that is too slow, too large, or too hidden to photograph. The sequence itself becomes the explanation, and a dry how-it-works topic turns into something people share.
4. Imperva: Are You SLAcking Off? (Animated GIF)
Imperva added looping motion to a 2017 infographic based on a survey of about 300 DevOps professionals about SaaS availability. The graphic distinguishes promised uptime from actual uptime: 7% reported actual 100% uptime, while 53% of surveyed companies had no status page showing availability or downtime. The 7% is the share reporting perfect uptime, not an uptime rate of 7%. The illustrations move around the fixed survey panels, drawing attention without hiding the numbers.
The lesson: you do not need a new production to animate. Keep the survey labels fixed while animating the surrounding illustrations, so movement draws attention without making the numbers harder to read.
5. Hamilton Lane: Why Invest in Private Markets (Interactive)
Hamilton Lane, a global private-markets investment firm, built a scroll-driven interactive infographic to explain a dense financial topic. Connected lines, definition cards, and tables organize the page into a vertical reading path. A Definitions link jumps to the glossary, giving the reader a way to check terms without following a fixed video timeline.
The lesson: use reader-controlled navigation when the material needs careful study. This is an interactive counterpart to the animated examples: the layout connects the ideas while the reader controls the pace.
Want to see how these formats look as finished brand work? Our portfolio collects animated infographics, explainers, and motion-graphics campaigns across SaaS, finance, and consumer brands.
For a wider look at the animation styles these examples draw from, our 2D animation examples gallery covers the techniques behind the motion.

What Makes an Animated Infographic Work
The best animated infographics share four habits, and none of them are about fancy effects. They are about using motion to make one idea land.
Animate the one thing that matters first. Pick the single number that carries the message, then support it with three to five figures at most. A data dump with everything moving at once is just a static infographic with extra steps. The Josys and Easy Agile examples both work because each frame has one clear focus before the next arrives.
Use the count-up. A number that animates from zero to its final value reads as an achievement earned in front of the viewer. A number that simply fades in reads as a label. Bars that grow, rows that arrive one at a time, and maps that fill in region by region all use motion to carry the eye between figures and build a small sense of momentum.
Control the pace. This is the real advantage of animation over a static graphic. A static infographic asks the reader to find the important part themselves. A video can reveal information in order at a speed the creator sets; a looping GIF can add movement within fixed panels. The honest benefit here is attention and pacing. Use motion to emphasize the intended reading order, while keeping the information legible if the viewer pauses.
Design the layout before you animate it. Every strong example starts as a solid static composition. If the still frame is confusing, motion only makes it more confusing, faster. Lock the hierarchy, the grid, and the data story first, then add movement to guide the reader through the structure you already built. For more on how these techniques map to different styles, see our breakdown of the types of motion graphics.
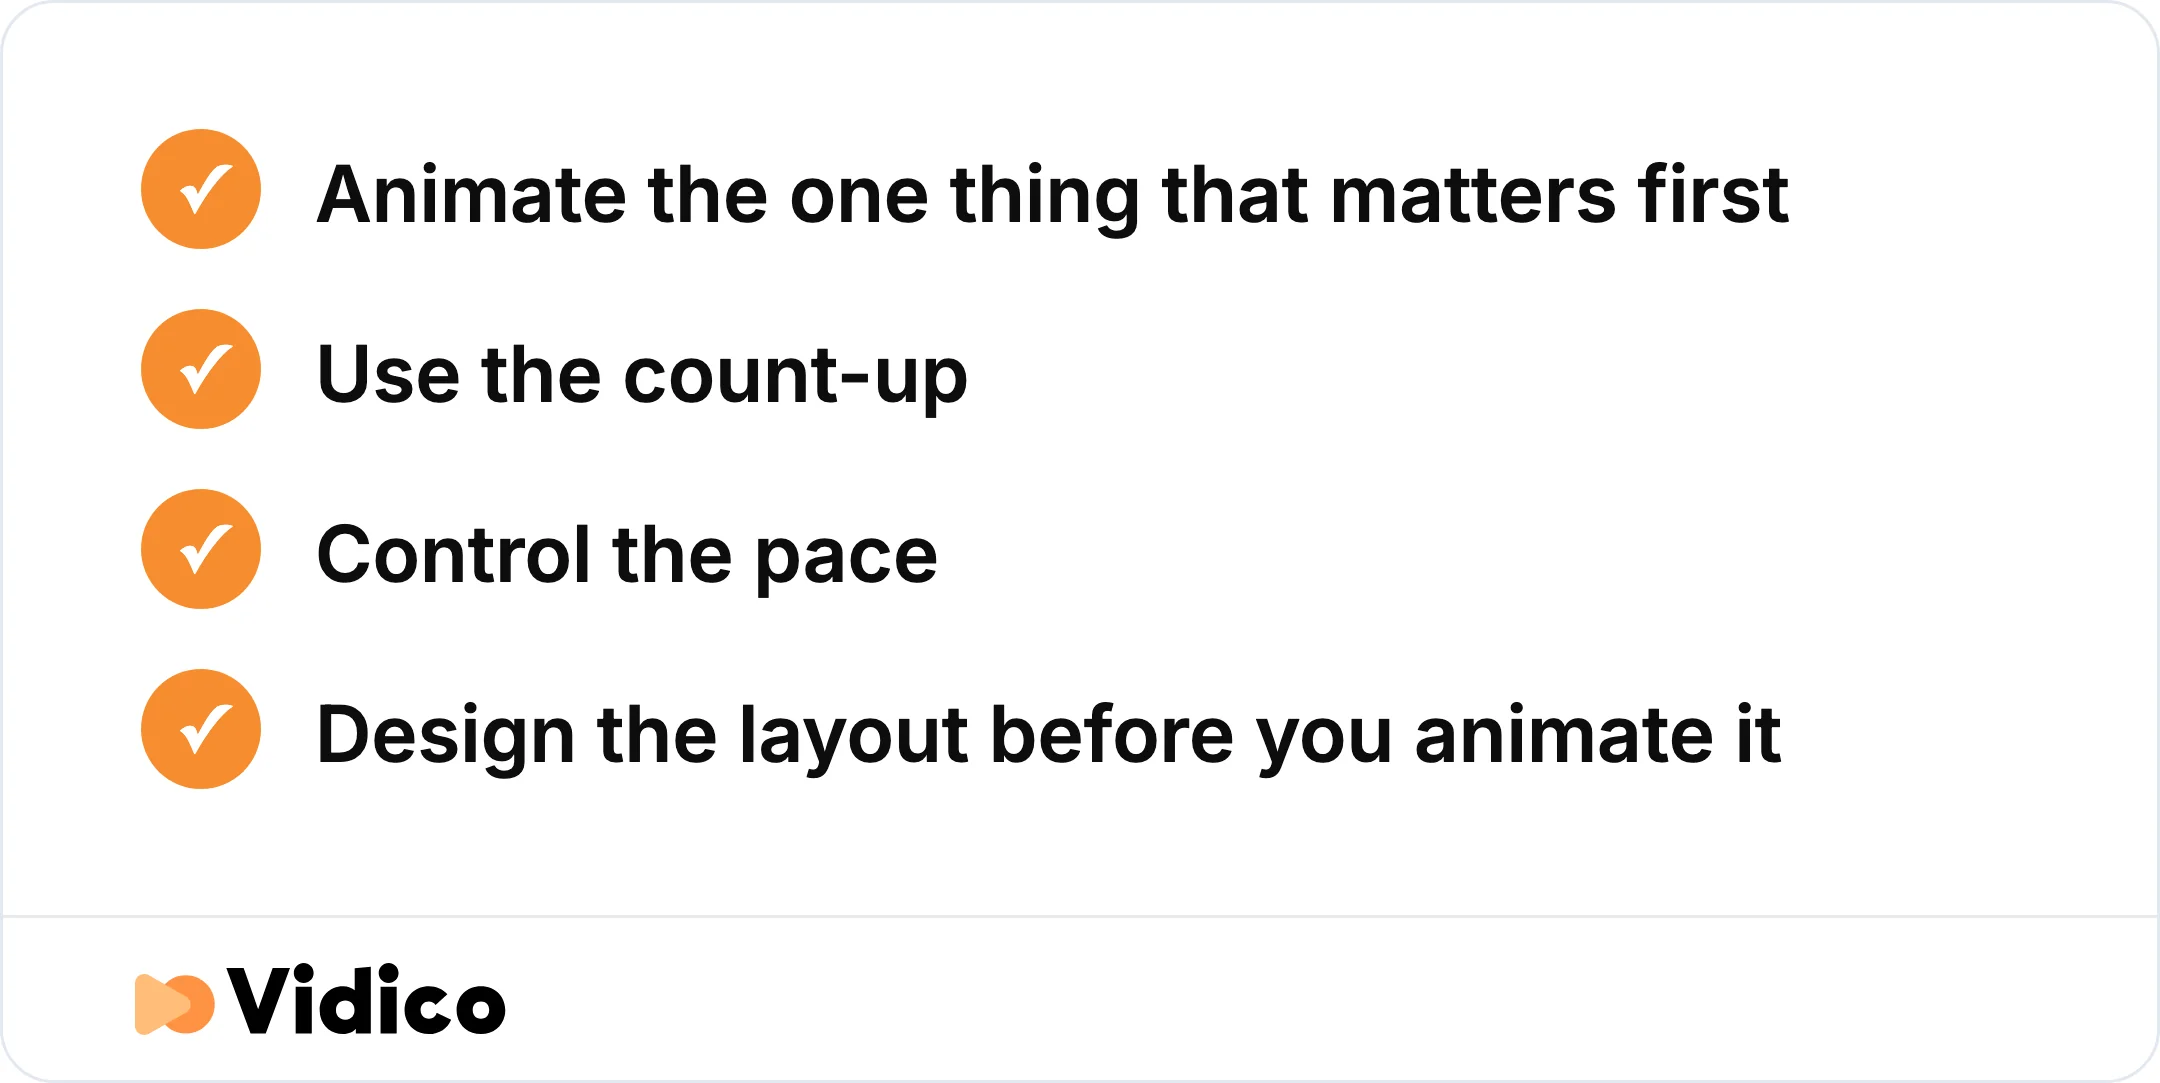
Four habits every strong animated infographic shares, and none of them are about effects.
Not sure which of your data stories would actually benefit from animation? Our Creative Intelligence Report is a free competitive analysis that shows where motion would move the needle against the content your market is already producing.
How to Make an Animated Infographic
Making an animated infographic follows five steps, whether you build it yourself or commission it.
- Define the one takeaway. Write the single sentence you want the viewer to repeat afterward. Everything in the piece serves that sentence or gets cut.
- Gather and verify the data. Pull the figures, confirm each one against its primary source, and note the date. An animated wrong number is still a wrong number, just a more memorable one.
- Design the static layout. Build the full composition as a still first. Set the hierarchy, the color system, and the order the data will appear in.
- Animate with intent. Add motion only where it directs attention: the count-up on your hero stat, the sequence that reveals a process, the transition that connects two ideas.
- Test and publish. Check that it reads with the sound off, that it loops cleanly if it is a GIF, and that it works at the size it will actually be viewed on.
For tools, the DIY path starts with Canva, PowerPoint, or Adobe After Effects. Canva and PowerPoint handle simple entrance effects and short GIF loops. After Effects is the step up for true motion-graphics video, with a steeper learning curve to match. We use AI to speed up parts of this work, such as generating subtitle variations and repurposing a long piece into short cutdowns, while our creative directors own the brief and every final frame. The tool is not the hard part. The hard part is deciding what to animate and what to leave still.
When the data is the story, a launch, an annual report, or a paid campaign, a professional animated infographic design usually earns its budget. Animated production costs more than static design, with motion graphics ranging from about $1,000 to $15,000 per finished minute depending on complexity. The return comes from the piece working harder: in our State of Creative in Tech report, a 2026 survey of more than 230 B2B tech marketers, paid social video and customer-proof video tied as the highest-impact content formats for the year.
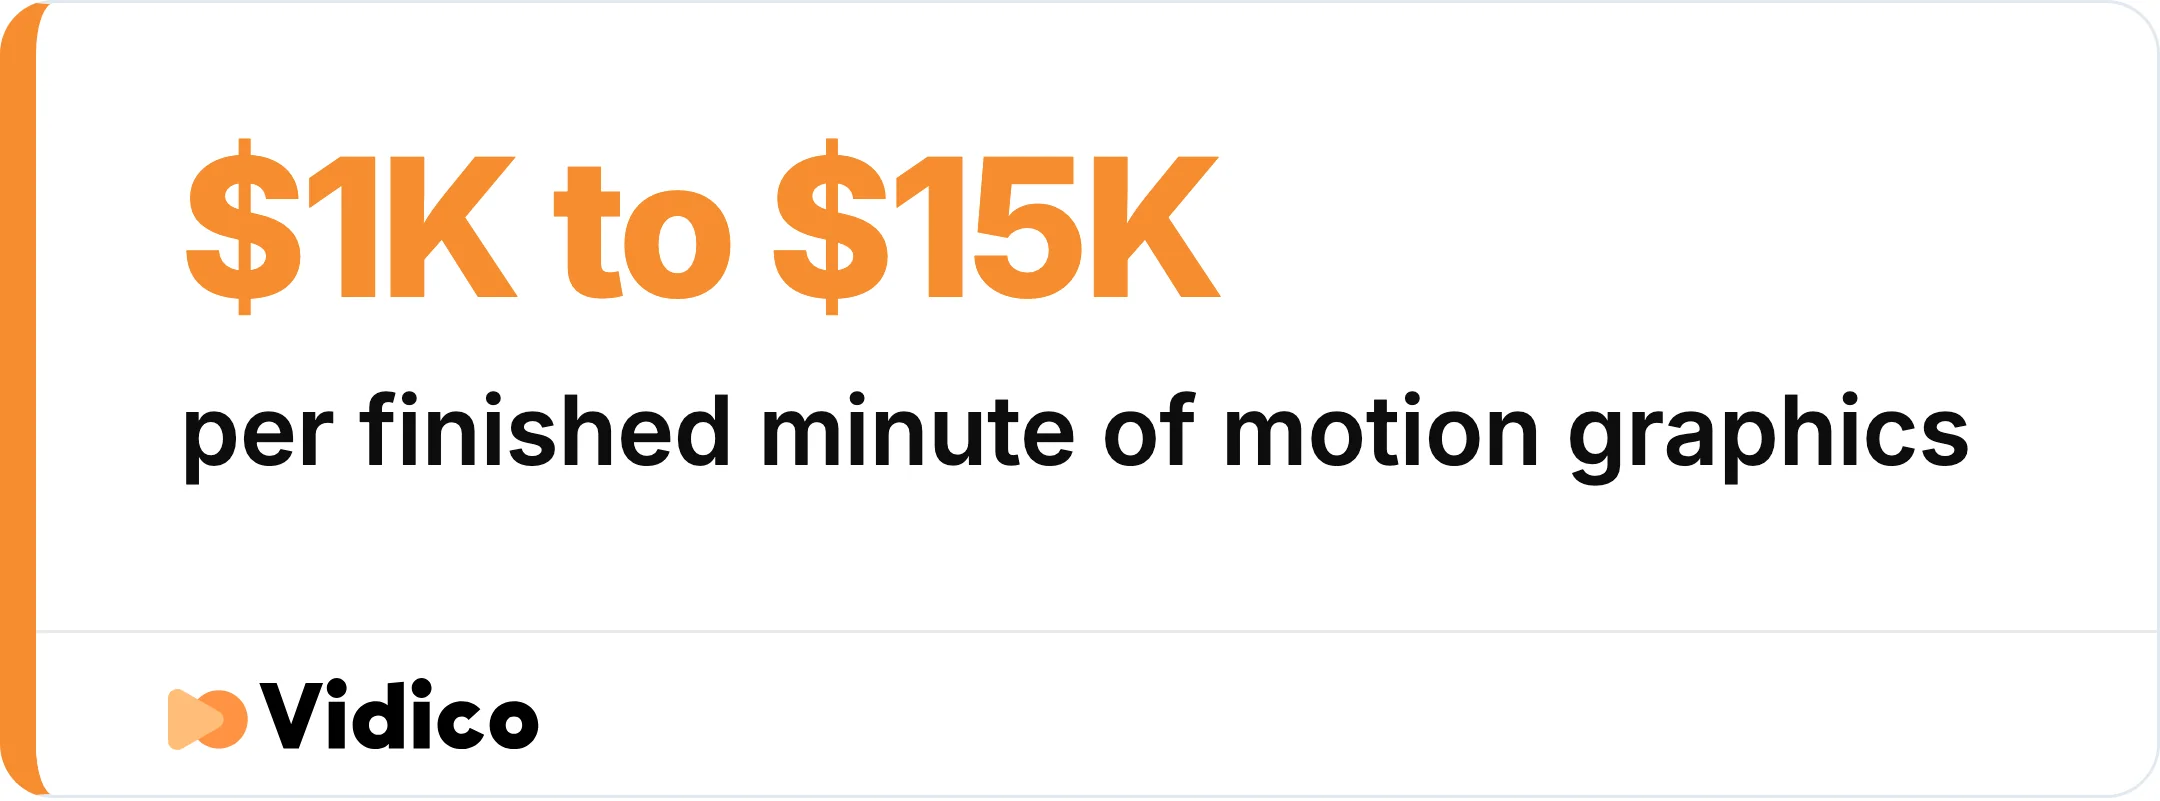
Animated production costs more than static design, with the range set by complexity.
Animated Infographic FAQs
What is a good example of an animated infographic?
BigRentz’s subway-construction GIF is a useful process example: fixed labels explain the stages while moving cross-sections show equipment and trains. For B2B product information, the Josys feature-demo system uses one reusable animated framework across eight short demos.
How do you make an animated infographic?
Start by writing the single takeaway you want to land, then gather and verify your data, design a static layout, and only add motion where it directs attention. You can build simple loops in Canva or PowerPoint, step up to Adobe After Effects for full motion-graphics video, or commission a studio when the piece is tied to a launch or campaign.
What are the main types of animated infographics?
There are three main types. An animated GIF infographic is a short silent loop for email and social. A motion-graphics video infographic combines voiceover, typography, and data for explainers and ads. An interactive infographic is a web piece where the reader scrolls or clicks through connected information.
Are animated infographics better than static ones?
It depends on the goal. Animated infographics are better when you need to direct attention, show a process or trend, or make a piece shareable, because motion controls what the viewer sees and when. Static infographics still win for quick reference, print, and anything a reader needs to scan at their own pace. Animation also costs more to produce, so the format should match the job.
The Bottom Line on Animated Infographics
The animated infographic examples that work all do the same thing. Videos and GIFs use motion to direct attention through a sequence. Interactive reports give the reader more control over the pace. In both cases, a clear layout should make the information easier to follow.
At Vidico, we build animated infographics and motion-graphics systems for B2B and SaaS teams that need their data to actually land. Our Easy Agile case study reports a Gold MUSE Award and four times the industry-average click-through rate for the campaign. Its simple shapes and product cards show how a consistent visual system can connect an abstract message to concrete software tasks.
If you have data worth animating, book a free strategy session and we’ll help you decide which format fits the story and where motion would make the biggest difference.